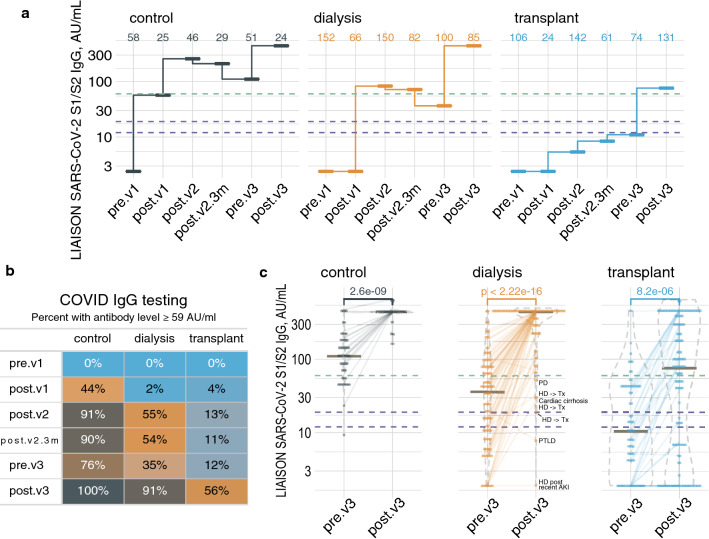
Fig. 1.
Antibody levels repeatedly measured across study groups and time points in patients not previously infected with COVID-19. a Median plots showing the summarized antibody level in a logarithmic scale in controls (left), dialysis patients (middle) and transplant patients (right). The dashed purple lines represent the equivocal range (12–19 AU/ml), while the dashed green line represents our proposed protective threshold, 59 AU/ml. b The percentage of participants with threshold or higher antibody level at each time point, by group. c Dot and violin plots, with horizontal lines at medians, focused on the latest study time points. Semi-transparent lines connect repeated measurements from the same participant. Time point abbreviations: pre.v1, before vaccination; post.v1, after a single jab; post.v2, up to 10 weeks after the second dose; post.v2.3m, 3–5 months after double vaccination; pre.v3, 6 months after double vaccination; post.v3, 8–117 days after the booster shot (colour figure online)

