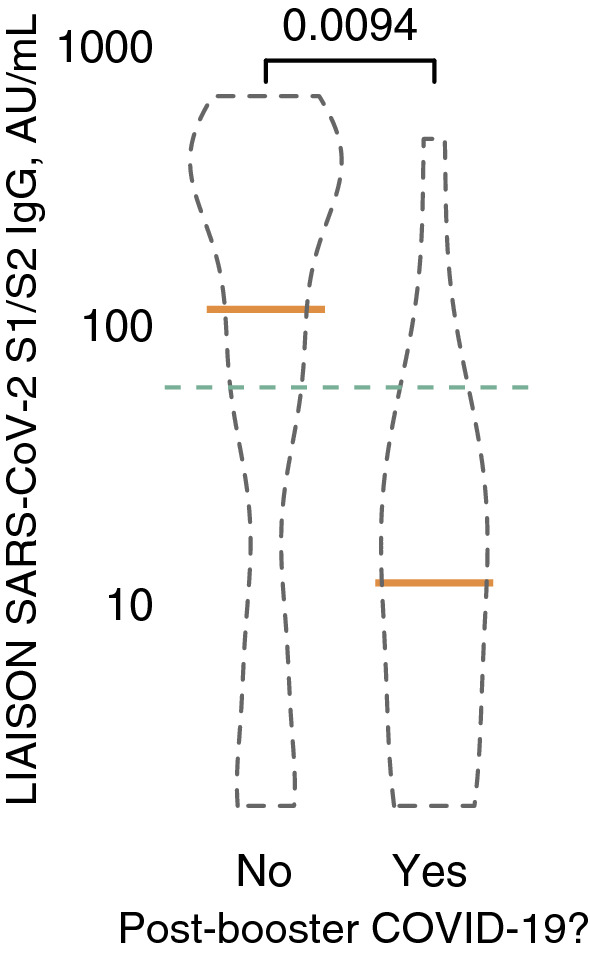
Fig. 2.

Anti SARS-CoV-2 S1/S2 IgG levels in patients and controls who experienced COVID-19 infection after receiving a booster dose of the BNT162b2 vaccine (right violin plot, n = 19) versus those who were not infected (left violin plot, n = 479). The green dashed line represents the proposed 59 AU/ml protective cutoff. Statistical significance was not affected by adjustment for age, sex or study group (not shown) (colour figure online)
