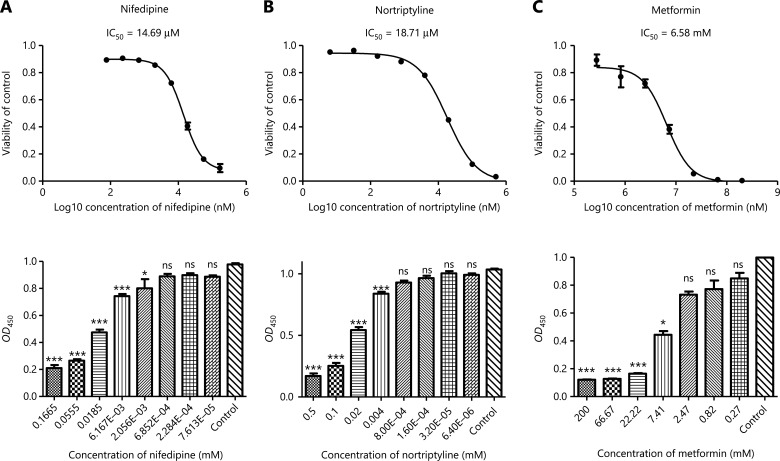
Figure 4.
Experimental validation of cancer cell growth inhibition caused by nifedipine, nortriptyline, and metformin in LNCaP cells. (A–C) Nifedipine, nortriptyline, and metformin, compared with DMSO, produced dose-dependent antiproliferative effects in LNCaP cells (n = 3). Nifedipine and nortriptyline both produced much lower IC50 values than metformin, a repurposed drug reported to have antitumor activity. Cell viability was measured with cell counting kit-8 (CCK8) assays, and OD450 represented the absorbance (optical density, OD) read at a wavelength of 450 nm. Data are presented as the mean ± SEM. Statistical significance was calculated with the Kruskal-Wallis test and Dunn’s test (multiple comparisons among treatment groups and controls). One asterisk indicates P < 0.05, 2 asterisks indicate P < 0.01, and 3 asterisks indicate P < 0.001. NS represents no statistical significance.

