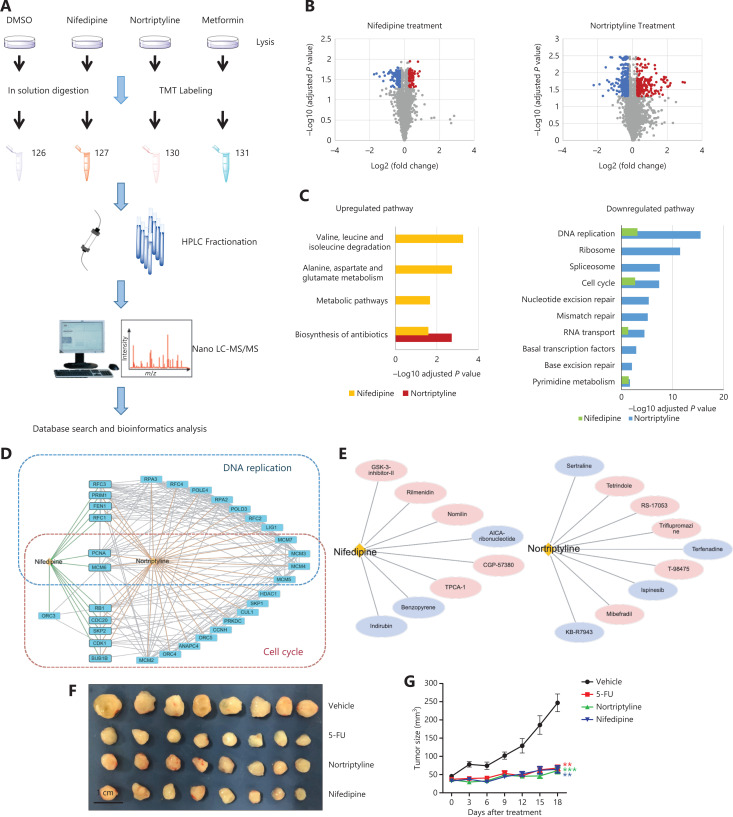
Figure 5.
Nifedipine and nortriptyline induced changes in global protein expression in LNCaP cells and inhibited the growth of prostate tumors in a xenograft model. (A) The workflow of the TMT-based quantitative proteomic profiling of LNCaP cells with treatment of DMSO, 70 μM nifedipine, 70 μM nortriptyline, and 70 μM metformin. (B) A volcano plot was used to relate the fold change to the adjusted P value. Red dots represent proteins with significant differences and fold changes >1.2, whereas blue dots represent proteins with significant differences and fold changes <0.83. (C) KEGG pathway analysis of up- and downregulated proteins in response to nifedipine and nortriptyline treatment. (D) Protein–protein interaction network of downregulated proteins in 2 important pathways (DNA replication and cell cycle) upon nifedipine/nortriptyline treatment. Interaction networks are listed with gene names according to the STRING database. (E) Drug compound similarity in terms of the gene expression profile from CMAP. The compounds reported to have effects on prostate cancer are highlighted in purple. (F) Image of tumors from mice treated with vehicle (saline solution), or a single dose of 5-FU (50 mg/kg), nortriptyline (30 mg/kg), or nifedipine (50 mg/kg) intraperitoneally (n = 8 per group). (G) Tumor growth curve of mice. Data are presented as the mean ± SEM, and statistical significance was calculated with the Kruskal-Wallis test and Dunn’s test (multiple comparisons among treatment groups and controls). One asterisk indicates P < 0.05, 2 asterisks indicate P < 0.01, and 3 asterisks indicate P < 0.001.

