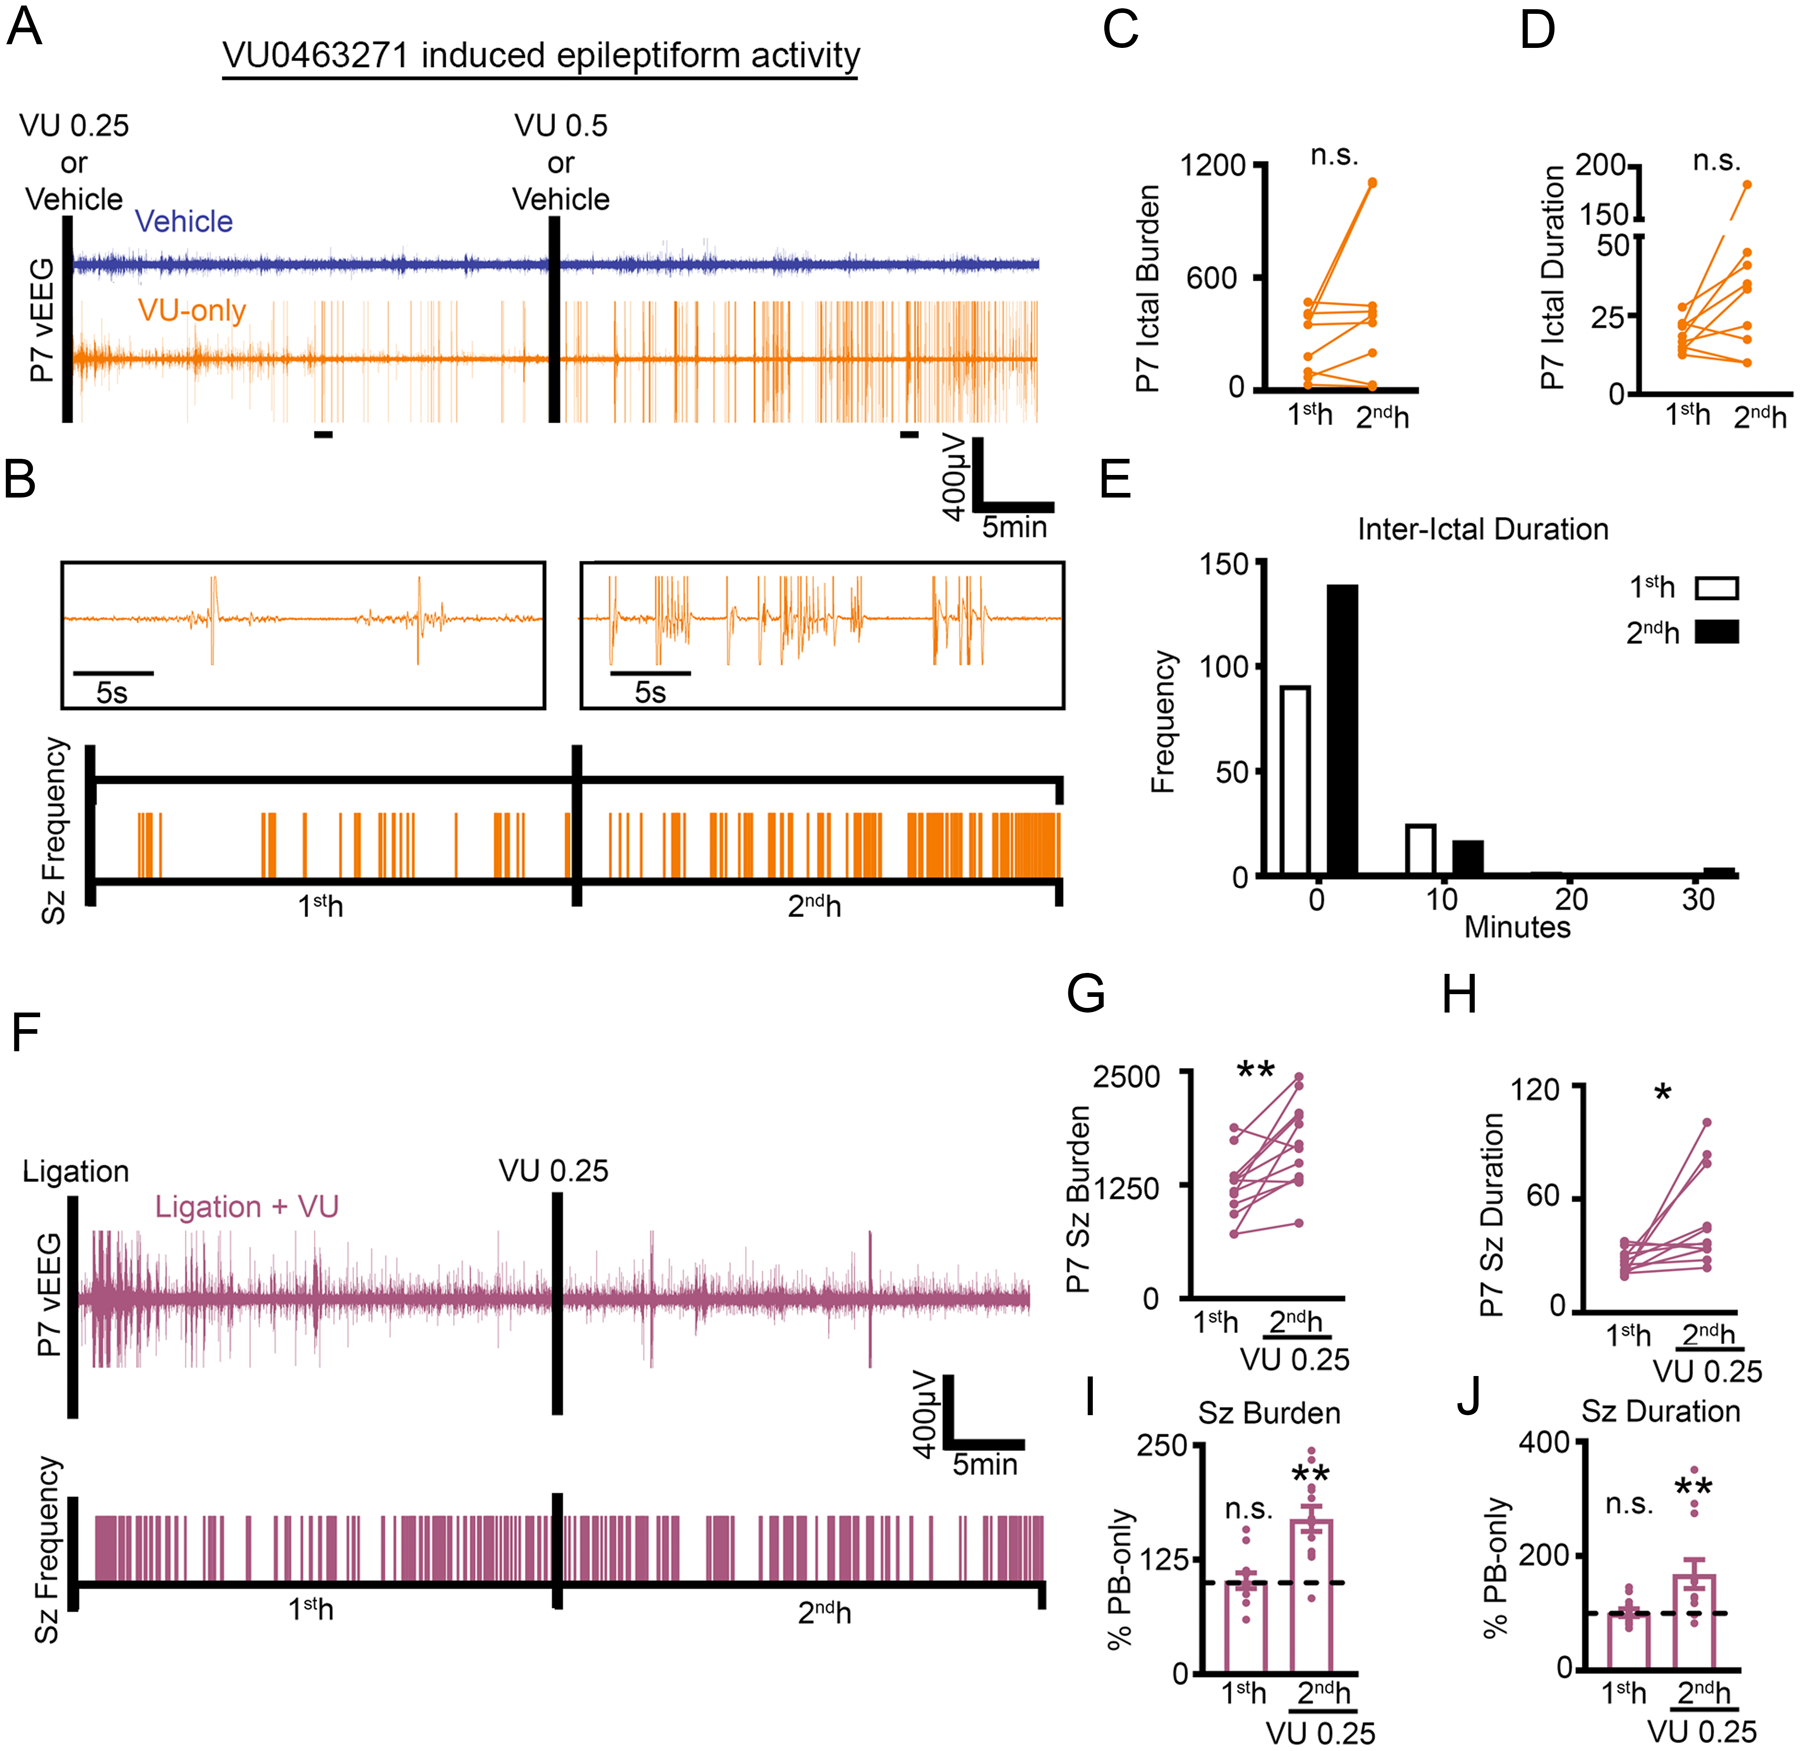
Fig. 5. Selective KCC2 antagonist VU induced spontaneous epileptiform discharges in P7 pups.

(A to E) Representative EEG traces (A) and ictal event frequency raster plots (B) from P7 CD-1 pups that were administered either vehicle or VU0463271 (VU); black bars note i.p. injections. Expanded timescales show VU-induced epileptiform activity in the 1st- and 2nd-hour. 1st- vs. 2nd-hour ictal burden (C) and duration (D) after VU administration. Total frequency distribution for all interictal durations in P7 CD-1 pups administered VU(E). Vehicle, n=4 pups; VU, n=8 pups. (F to J) Representative EEG trace and seizure frequency raster plot (F) of P7 CD-1 pups that underwent unilateral carotid ligation with administration of VU 0.25 mg/kg at 1 hour (denoted by black bar). 1st- and 2nd-hour seizure burden (G) and duration (H). (I and J) 1st- and 2nd-hour seizure burden and duration plotted as percent PB-only. Data plots show all data points with means ± SEM. **P<0.05 and **P<0.01 by two-tailed paired t-test. Ligation + VU n=12 pups.
