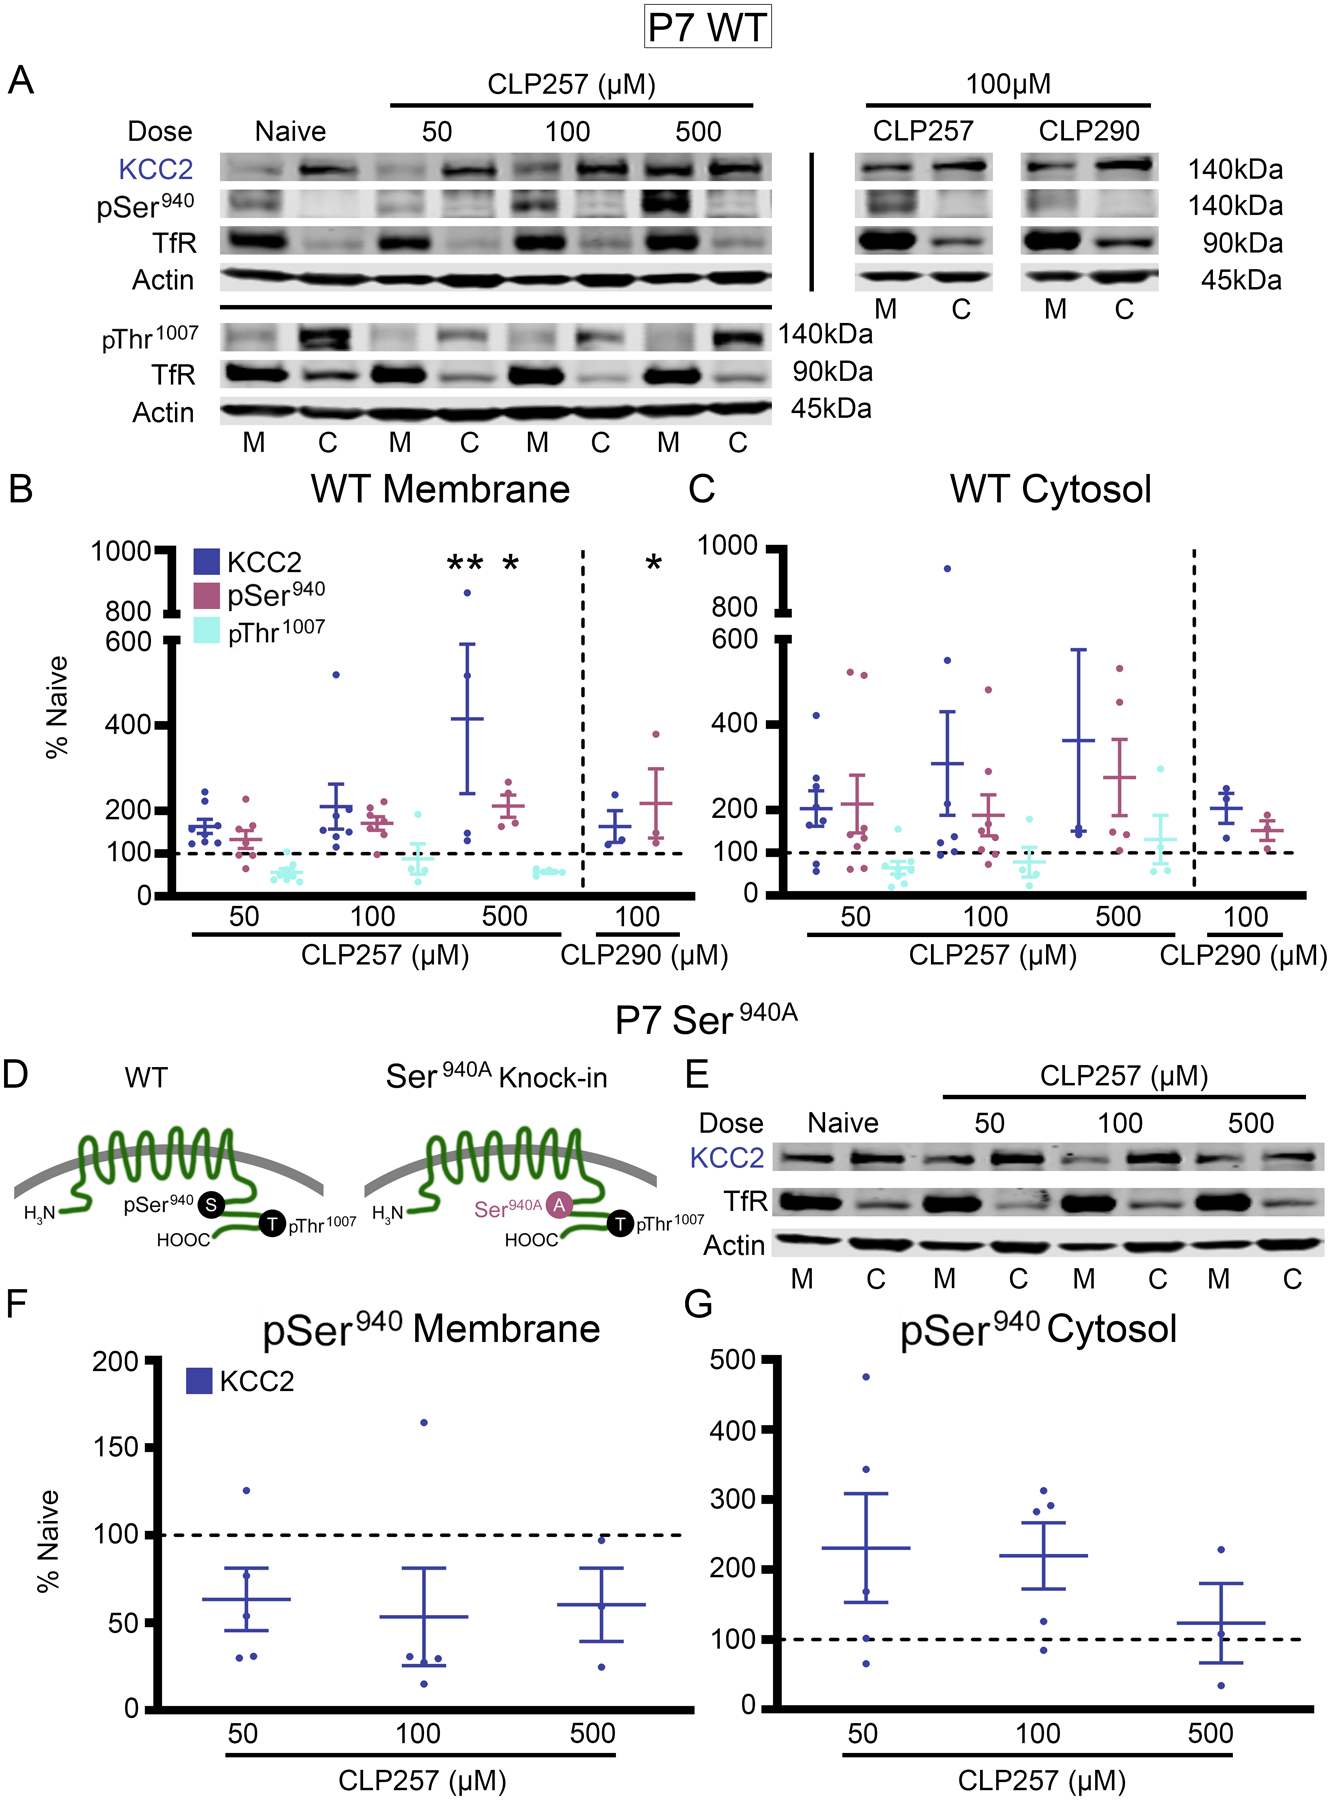
Fig. 7. In vitro CLP257 treatment upregulated membrane KCC2 expression and Ser940 phosphorylation.

(A) KCC2, Ser940, and Thr1007 in the plasma membrane (M) and cytosol (C) for all treated P7 wild-type (WT) brain slices. (B) KCC2, Ser940, and Thr1007 in the membrane and (C) cytosol for all treatment groups plotted as percent of naïve. Number of WT P7 pups: n=8 (50 μM CLP257), n=7 (100 μM CLP257), n=4 (500 μM CLP257), n=3 (100μM CLP290). (D) Graphical representation of S940A+/+ knock-in mutant mice (41). (E to G) Western blotting for KCC2 expression in the plasma membrane and cytosol for all treated brain slices from S940A+/+ P7 pups (E). Quantified KCC2 expression in the membrane (F) and cytosol (G) for all S940A+/+ treatment groups plotted as percent of naïve. All proteins of interest in the cytosol were normalized to housekeeping protein β-actin; all proteins of interest in the plasma membrane were normalized to transferrin (TfR); and phosphoproteins were normalized to their respective total protein. Data plots show all data points with means ± SEM. * P<0.05 and ** P<0.01 by one-way ANOVA. S940A+/+ P7 pups: n=5 (50μM CLP257), n=5 (100μM CLP257), n=3 brain slices (500μM CLP257).
