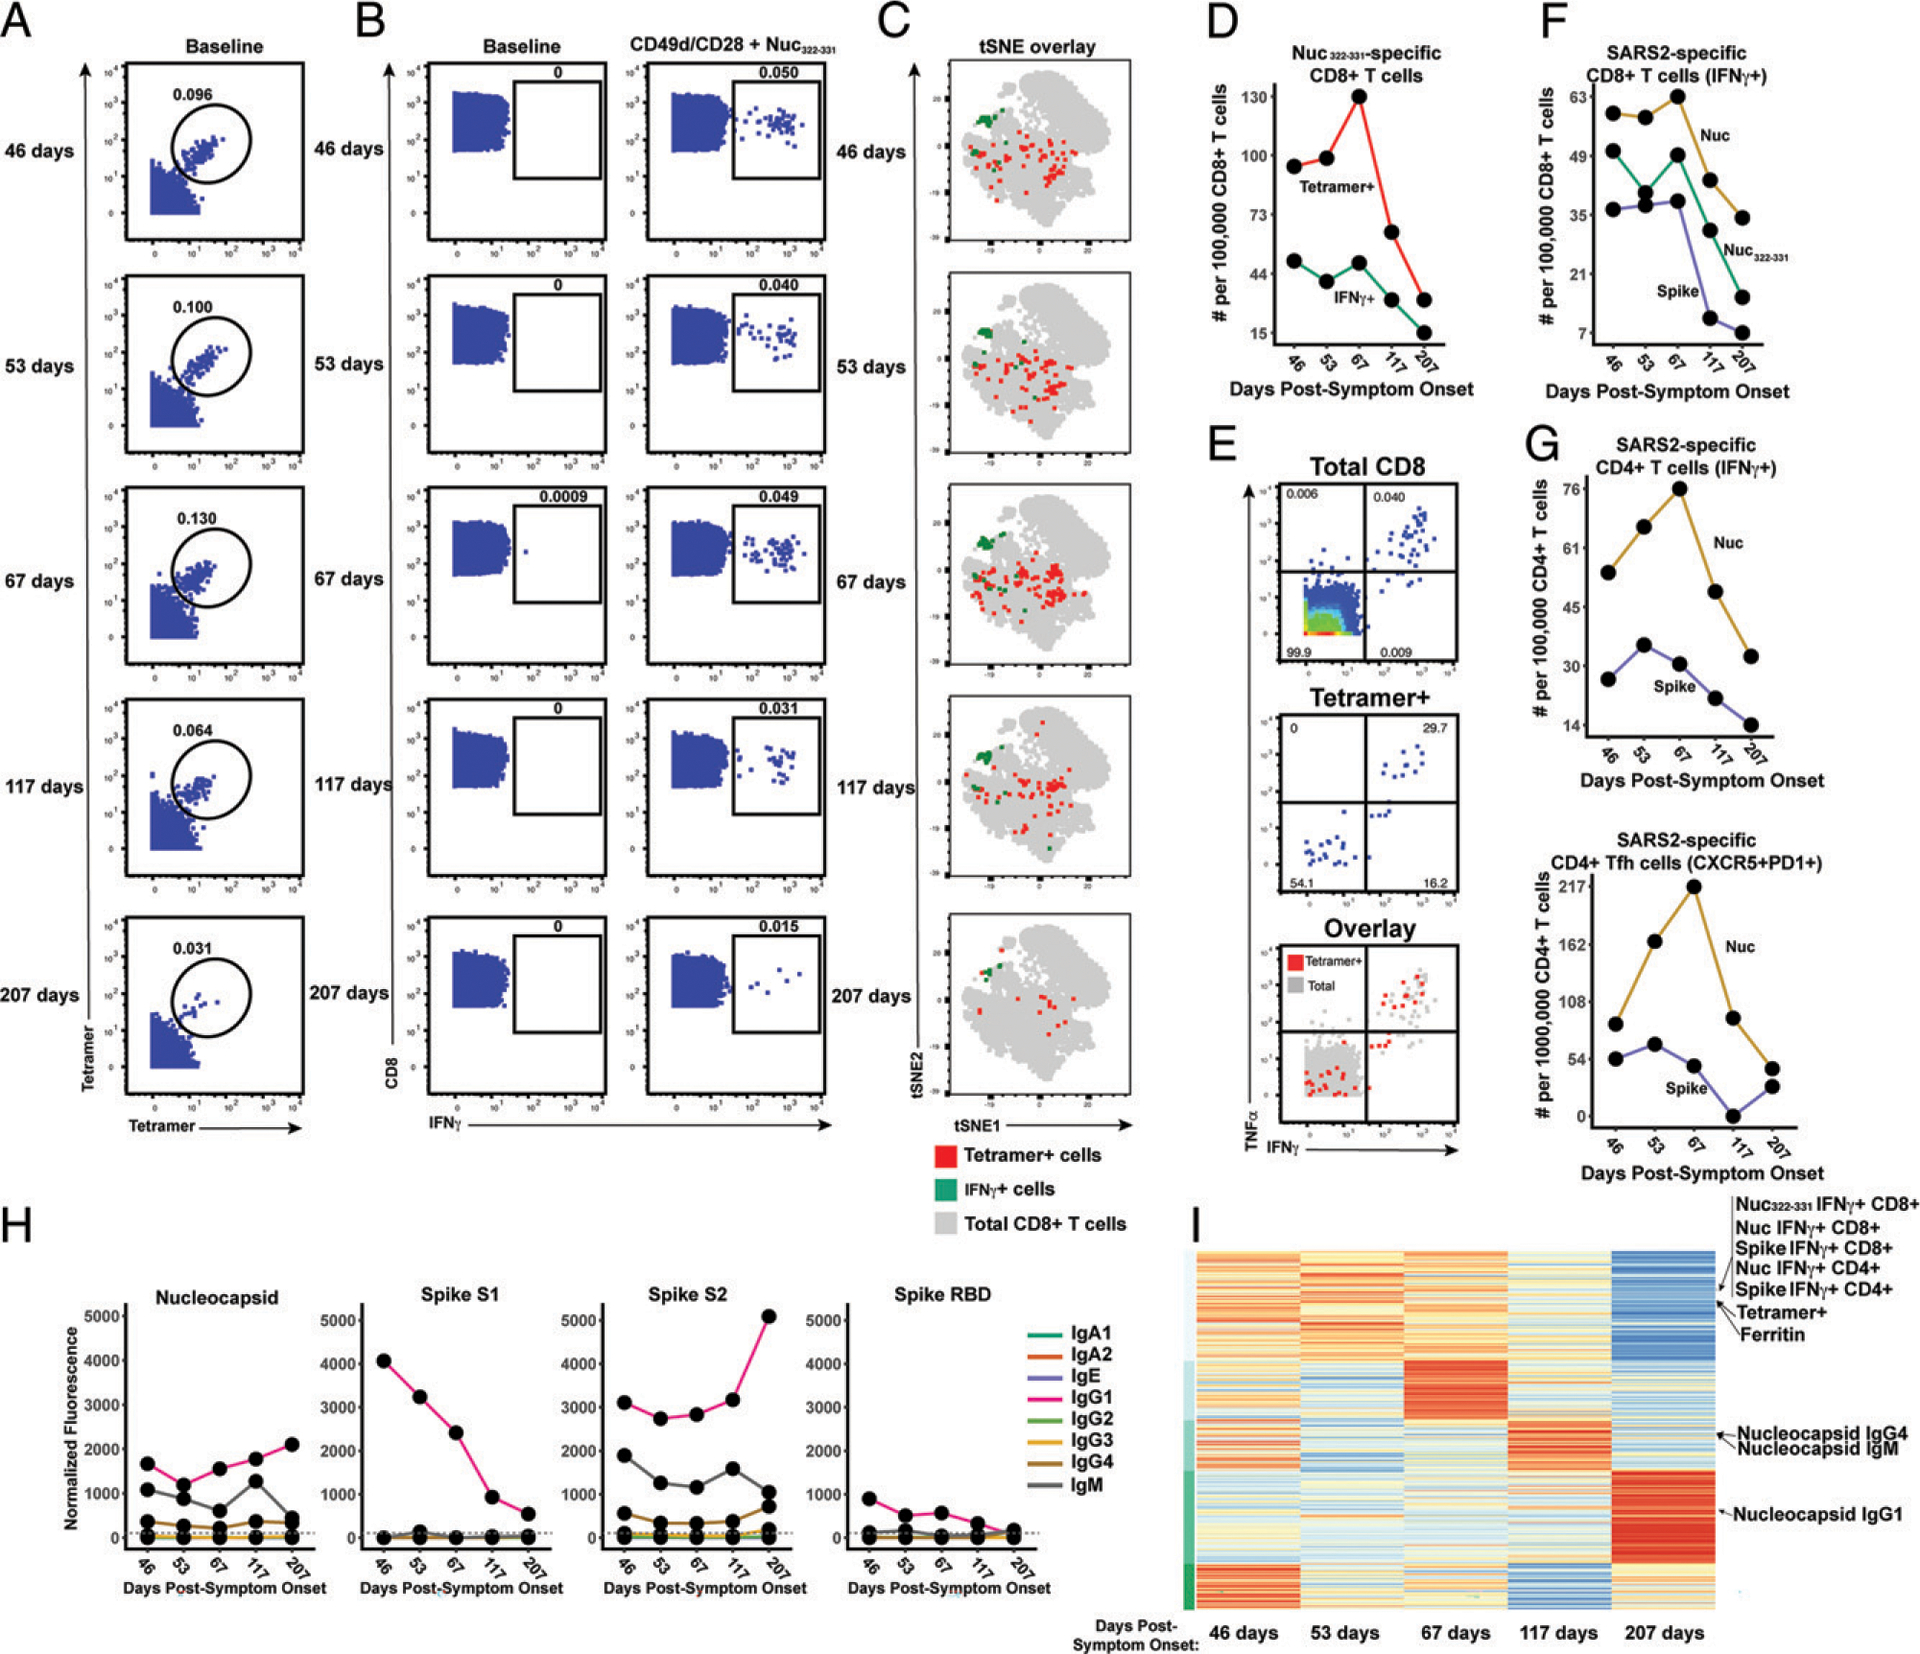
FIGURE 2.

Longitudinal assessment of Nuc322–331–specific CD8+ T cell responses in PID4103 reveals coordination with other components of Ag-specific adaptive immunity. (A) Identification of Nuc322–331–specific CD8+ T cells by CyTOF. Baseline specimens that never underwent any stimulation were stained with HLA-B*40:01/Nuc322–331 tetramers detectable on two different CyTOF channels. The timeline refers to days since symptom onset. Numbers correspond to the percentage of cells within the gate. Results are gated on live, singlet CD3+CD8+ cells. (B) CD8+ T cells specifically producing IFN-γ in response to Nuc322–331 stimulation were detected at all five timepoints. Numbers correspond to the percentage of cells within the gate. Results are gated on live, singlet CD3+CD8+ cells. (C) Tetramer+ and IFN-γ+ cells responding to Nuc322–331 treatment reside in unique regions of the tSNE, suggesting phenotypic changes elicited by cognate peptide recognition. tSNE plots of total CD8+ T cells (gray), tetramer+ (red) from the baseline samples, and IFN-γ+ (green) cells from the peptide-stimulated samples over the course of convalescence of PID4103. Datasets correspond to those extracted from the data presented in (A) and (B). (D) The tetramer+ response is higher in magnitude than the IFN-γ+ response but exhibits similar kinetics, peaking 67 d postsymptom onset. Datasets correspond to those extracted from the data presented in (A) and (B). (E) Approximately half of tetramer+ cells in Nuc322–331–stimulated samples do not secrete IFN-γ or TNF-α. PBMCs from PID4103 were stimulated with Nuc322–331, stained with HLA-B*40:01/Nuc322–331 tetramers, and analyzed by CyTOF. A total of 54.1% of tetramer+ cells expressed neither IFN-γ nor TNF-α, suggesting that approximately half of tetramer+ cells are not identified using the cytokine secretion assay. (F) The responses of CD8+ T cell to Nuc322–331, the entire nucleocapsid protein (Nuc), and the entire spike protein are coordinated. Note that the IFN-γ+ response to Nuc322–331 is greater than the response to the entire spike proteins and less than the response to the entire nucleocapsid protein. (G) The total and Tfh CD4+ T cell responses against nucleocapsid peaks 67 d postsymptom onset, whereas the response to spike peaks slightly earlier. Total (left) or Tfh (CD4+CD45RO+CD45RA−PD1+CXCR5+) (right) CD4+ T cells responding to overlapping peptides spanning the entire nucleocapsid or spike proteins were assessed. (H) Titers of different Ab types against nucleocapsid, and the S1, S2, and RBD domains of spike monitored at the five timepoints and expressed as normalized fluorescence values (see Materials and Methods). The dotted line indicates the limit of detection. (I) Unsupervised k-means clustering of cells, Abs, and other biomarkers based on their abundance in PID4103’s blood across five time points. For each biomarker, abundance is normalized across time points and colored from red (highest) to blue (lowest). The CD4+ and CD8+ T cell against Nuc322–331, nucleocapsid, and spike clustered together. Interestingly, ferritin levels clustered close to them. In contrast, Ab responses against nucleocapsid were delayed and occurred after the peaks of the T cell responses. The green bars on the left correspond to clustering as determined by k-means.
