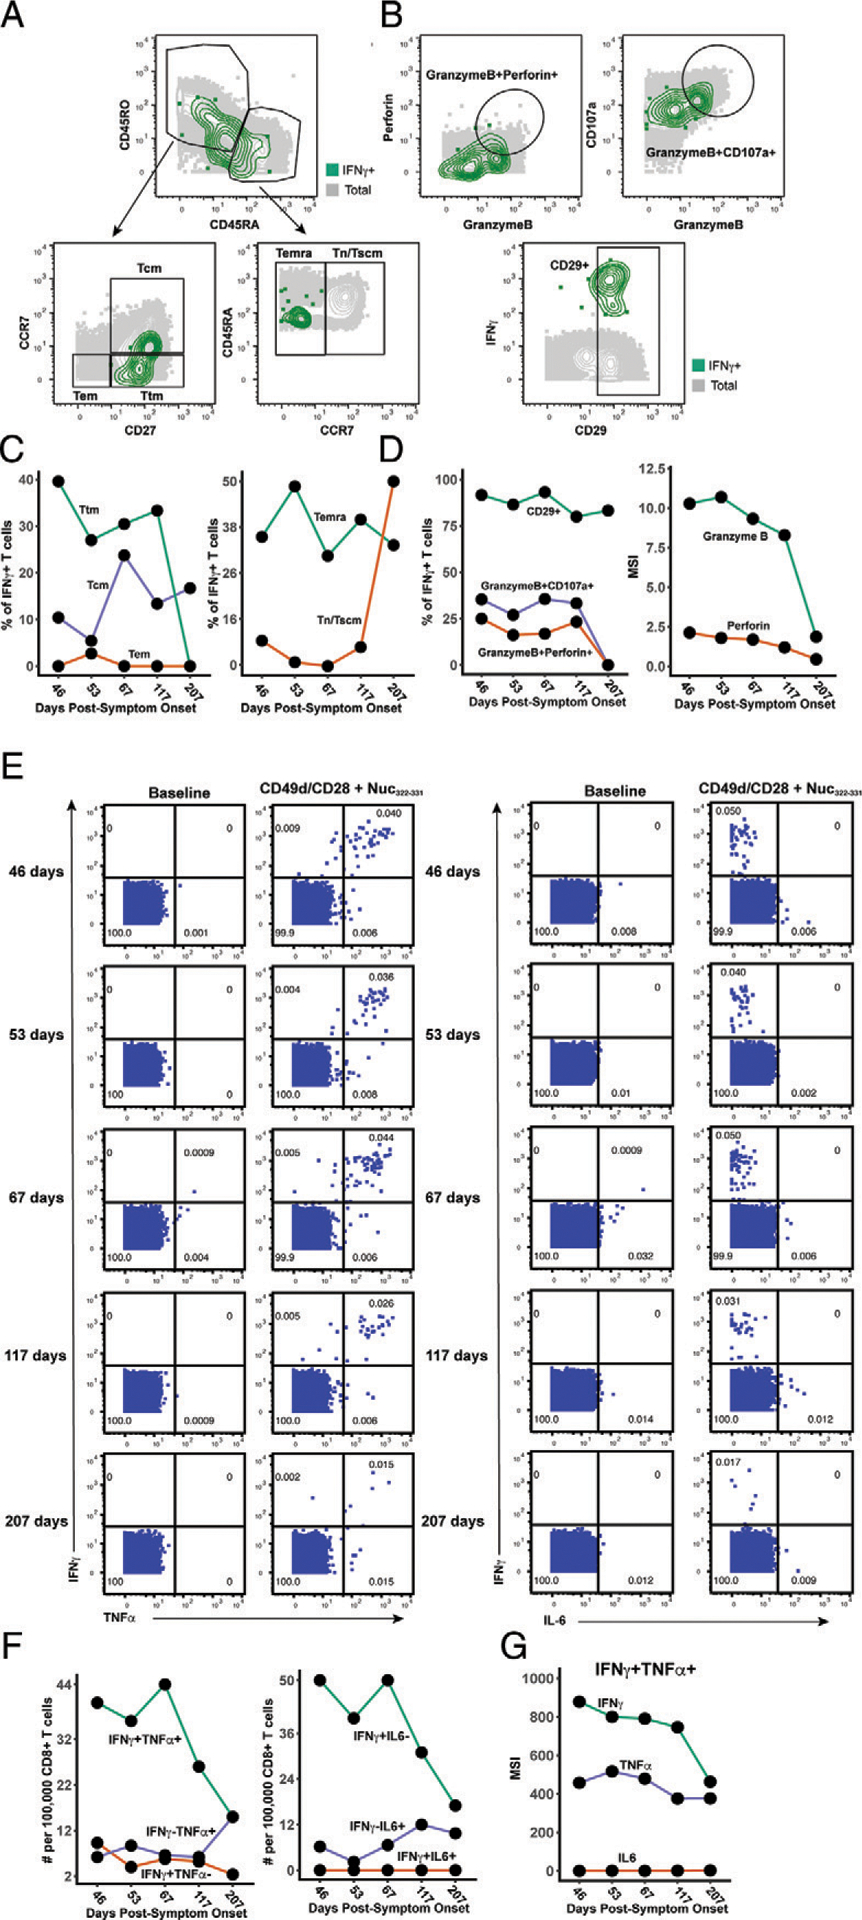
FIGURE 5.

Polyfunctional Nuc322–331–specific CD8+ T cells are detected months into PID4103’s convalescence. (A) Gating strategy to identify the Tcm, Tem, Ttm, Temra, and Tn/Tscm subsets of Nuc322–331–specific CD8+ T cells, identified as those responding to peptide stimulation by producing IFN-γ. The Nuc322–331–specific CD8+ T cells (IFN-γ+) cells are shown as green contours, and total CD8+ T cells are shown in gray. Subset definitions are identical to those used in Figure 3A. (B) Gating strategy to identify cytolytic Nuc322–331–specific CD8+ T cells among those inducing IFN-γ upon cognate peptide stimulation. Top, Gates defining CD8+ T cells coexpressing granzyme B and perforin or granzyme and CD107a are indicated. Bottom, Gate defining cells expressing high levels of CD29, a marker for cytolytic CD8+ T cells. (C) Proportion of IFN-γ+ Nuc322–331–specific CD8+ T cells belonging to the Tcm, Tem, Ttm, Temra, and Tn/Tscm subsets as defined in (A). The lower contribution of Tcm at all time points is likely mediated by activation-induced CCR7 downregulation. Similar to the tetramer data (Fig. 3D), an increase in the contribution of the Tn/Tscm subset was observed over time. (D) Cytolytic Nuc322–331–specific CD8+ T cells slowly decrease over the course of convalescence. Left, Proportion of IFN-γ+ cells that were CD29+, granzymeB+CD107a+, and granzymeB+perforin+. Right, Median expression levels of the indicated cytolytic activity markers on the IFN-γ+ cells. (E) Most Nuc322–331–specific CD8+ T cells responding to peptide stimulation secrete multiple cytokines. Dot plots showing the expression of IFN-γ and TNF-α (left) or IFN-γ and IL-6 (right) on CD8+ T cells among baseline or peptide-stimulated samples. Numbers correspond to the percentage of cells within the gates. Results are gated on live, singlet CD3+CD8+ cells. Most responding Nuc322–331–specific CD8+ T cells were IFN-γ+TNF-α+IL-6−. (F) The proportion of IFN-γ+TNF-α+IL-6−CD8+ T cells responding to Nuc322–331 stimulation decreases over the course of convalescence. The cell populations are taken from the gates shown in (E). (G) The level of IFN-γ and TNF-α produced by Nuc322–331–specific CD8+ T cells decreases over the course of convalescence, as shown by median signal intensity of the IFN-γ+TNF-α+ cells.
