
Fig. 3.
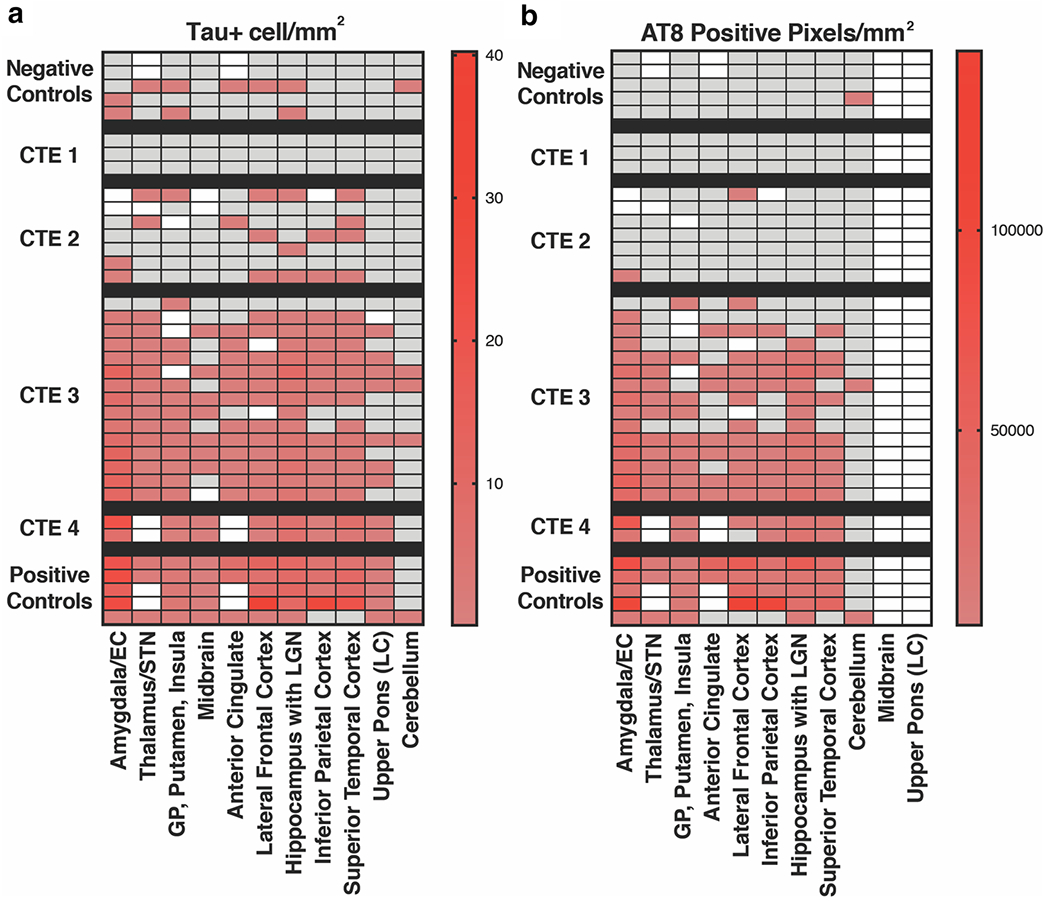
Quantification of tau AT8 histopathology in CTE. a p-tau pathology was quantified in specified tissue blocks by immunostain (AT8). Whole sections were outlined to determine total area of interest. White squares denote brain regions that were not available for analysis. Tau positive cells/mm2 is displayed using a 5 SD cutoff above control samples and quantified on a linear scale in arbitrary units. Gray delineates samples that were below this threshold. b Total AT8 positive pixels/mm2 were quantified in specified tissue blocks using image analysis and automated counting software as previously described [7]. Positive samples are displayed with a 5 SD cutoff above control samples, and quantified on a linear scale. Tissue blocks were selected based on previous work identifying brain regions of interest in CTE [24]. Midbrain and pons data could not be included in an automated assessment of AT8 histopathology due to neuromelanin pigmentation present in the substantia nigra and locus coeruleus, respectively