Figure 2.
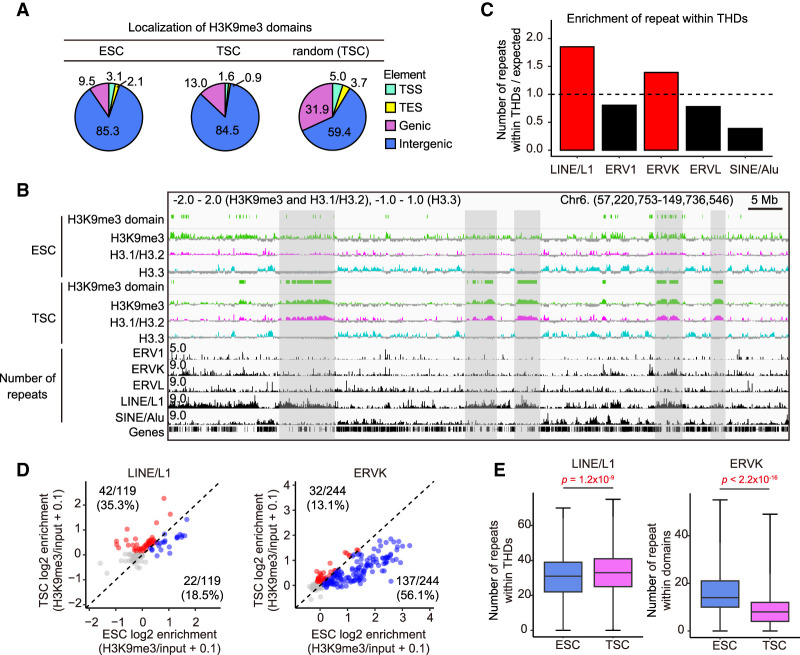
The H3K9me3 domains in TSCs (THDs) are preferentially localized in LINE/L1-rich regions. (A) Distributions of H3K9me3 domains in ESCs and TSCs (THDs). The THDs are preferentially distributed in intergenic regions as compared with the distribution by random mapping. (B) IGV snapshot of repeat elements and log2 transformed ChIP-seq data. Gray areas indicate the overlaps of TSC-defined H3K9me3 domains (THDs) and LINE/L1-rich regions. (C) Bar plot showing the enrichment of repetitive elements within the THDs in TSCs. Expected values represent the number of repetitive elements within randomly extracted regions. (D) Scatter plot showing the enrichment of H3K9me3 in ESCs and TSCs to LINE/L1 and ERVK. Each dot represents a subclass of retrotransposons. Red and blue dots indicate the specifically enriched subclasses in TSCs and ESCs, respectively, among subclasses with log2 enrichment >0. (E) Box plots showing the numbers of LINE/L1 and ERVK within H3K9me3 domains in ESCs and TSCs. P-values from the Wilcoxon rank sum test are indicated. There were 1517 bins analyzed for ESCs and 2281 bins analyzed for TSCs.

