Figure 3.
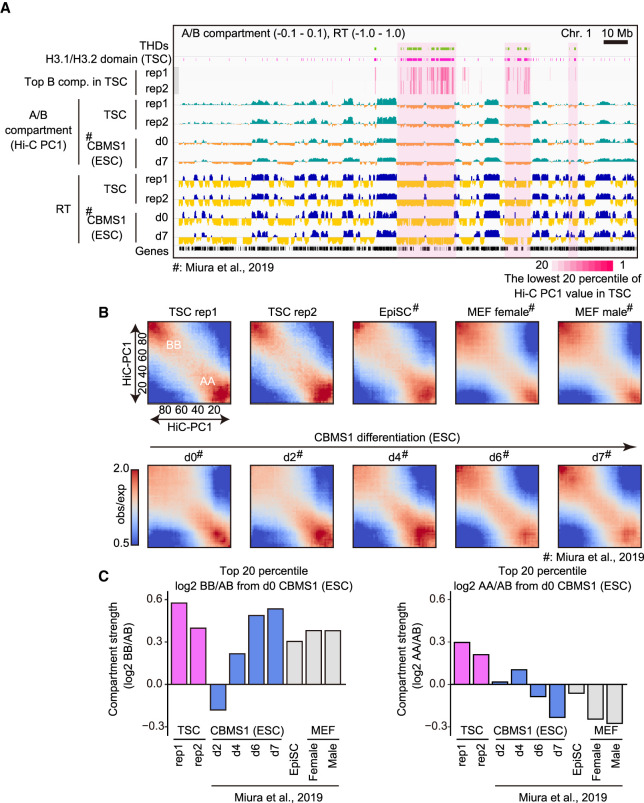
The THDs construct stable B compartment domains. (A) IGV snapshot showing the A/B compartments from Hi-C analysis and early/late replication timing from Repli-seq. Light-magenta areas indicate overlapped regions of THDs and the lowest 20 percentile of Hi-C PC1 values in TSCs. d0 and d7 CBMS1 ESCs represent the statuses of undifferentiated ESCs and differentiated ESCs for neurectoderm (7 d after differentiation), respectively. Hi-C and Repli-seq data for ESCs were obtained from Miura et al. (2019). (B) Heat map showing average contact enrichment between pairs of 200-kb bins sorted by their Hi-C PC1 values, from the lowest (the most extreme B) to the highest (the most extreme A). Names of cells, time points of ESC differentiation, and the scale bar of observed/expected ratio are as indicated. (C) Bar plots showing the differential ratio of B–B/A–B (left) and A–A/A–B (right) interactions between each cell and d0 ESCs. Note that TSCs show strong B–B compartment interaction as well as A–A compartment interaction.

