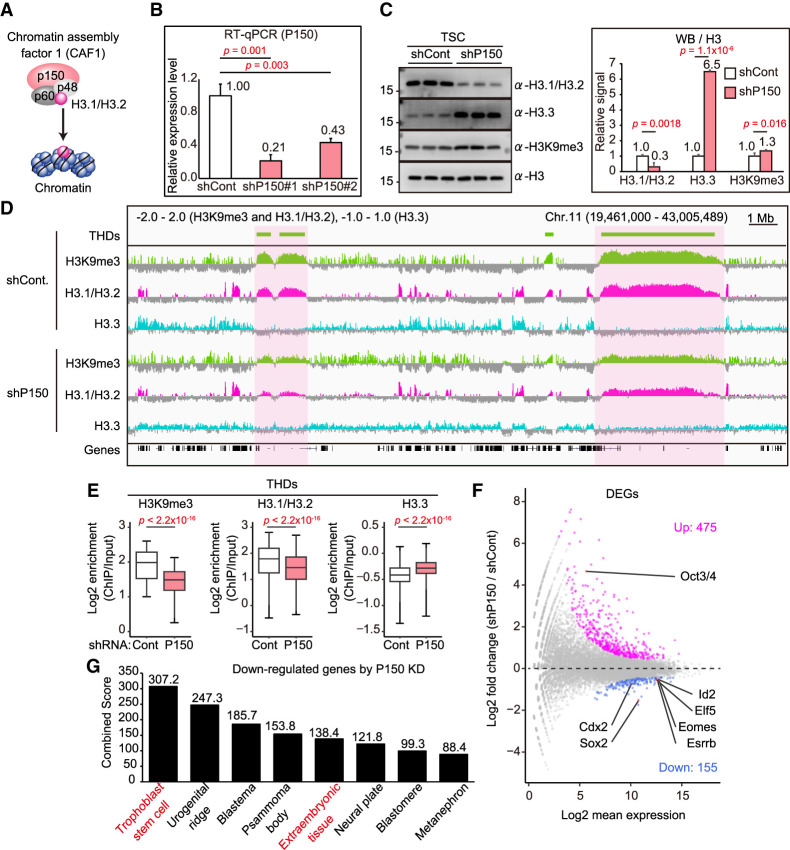
Figure 4.
H3.1/H3.2 regulates the THDs, as revealed by P150 knockdown. (A) Illustration of the CAF1 complex. P150 is a large subunit of the CAF1 complex and is responsible for H3.1/H3.2 assembly. (B) The effectiveness of knockdown of P150 in TSCs by RT-qPCR analysis. Two different shRNAs (shP150#1 and shP150#2) were used for the knockdown. (C) Western blot analysis of P150 knockdown TSCs. Representative images (left) and the relative signal levels (right) are shown. Signal intensities were normalized to H3 and are presented as levels relative to ESCs (set as 1.0). Data are presented as the mean ± SD. P-values were calculated from two-tailed, unpaired Student's t-tests. (D) IGV snapshots of large H3K9me3 (THDs) and H3.1/H3.2 domains in TSCs following P150 knockdown. The THDs, as well as the H3.1/H3.2 domains, were diminished by P150 knockdown. (E) Box plots showing enrichment of H3K9me3, H3.1/H3.2, and H3.3 within the THDs. P-values from the Wilcoxon rank sum test are indicated. There were 3434 bins analyzed. (F) Differential expression analysis of P150 knockdown TSCs. Significantly up-regulated (475) and down-regulated (155) genes in P150 knockdown TSCs are highlighted by magenta and blue, respectively. Up-regulated ESC marker gene (Oct3/4) and down-regulated TSC marker genes (Cdx2, Sox2, Elf5, Id2, Eomes, and Esrrb) are indicated. Genes with a Padj-value < 0.01 were extracted as differentially expressed genes (DEGs). (G) Gene set enrichment analysis using down-regulated genes in P150 knockdown TSCs. Down-regulated genes were subjected to Jensen Tissues through the Enrichr website. The combined score was calculated from the P-value and the z-score.

