Figure 3.
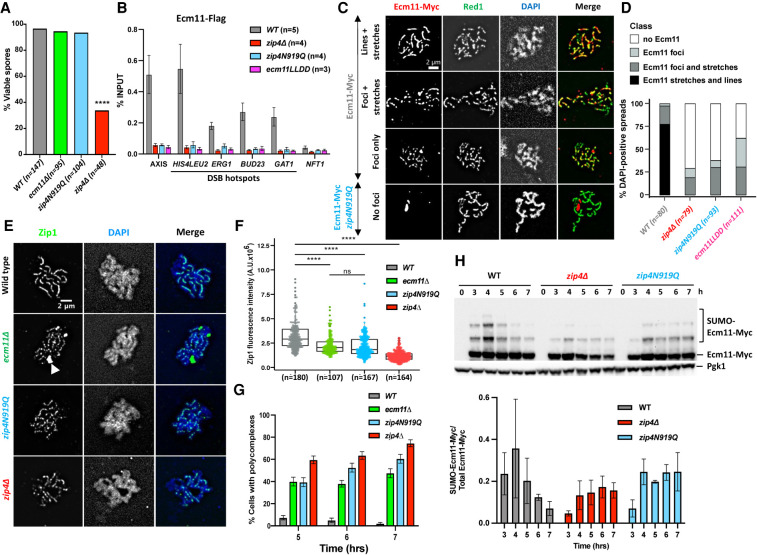
Synaptonemal complex assembly depends on the interaction of Ecm11 with Zip4. (A) Spore viability assays of strains with the indicated genotype. Numbers of dissected tetrads are indicated. (****) P < 0.0001, Fisher's exact test. (B) Maximum levels of Ecm11-Flag or Ecm11LLDD-Flag in the indicated strains measured by quantitative PCR (qPCR) using primers that cover the indicated regions are shown. Values are the mean ± SEM from at least three independent experiments. The full corresponding time courses are in Figure 1E and Supplemental Figure S5. (C) Ecm11-Myc localization on surface-spread chromosomes in the indicated strains. (Red) Anti-Myc, (green) anti-Red1, (blue) DAPI. Red1-positive spreads were divided into four categories: (1) exhibiting stretches and lines of Ecm11 (synapsis almost complete or complete), (2) exhibiting foci and stretches of Ecm11 (partial synapsis), (3) exhibiting only Ecm11 foci (dotty pattern), and (4) exhibiting no Ecm11. Representative pictures are shown for the indicated strain. The pictures for the other strains are in Supplemental Figure S6. (D) Quantification of the classes shown in C. The number of counted spreads is indicated. (E) Zip1 localization on surface-spread chromosomes in the indicated strains. Only pachytene or pachytene-like stages were considered. (Green) Anti-Zip1, (blue) DAPI (DNA), (white arrow) Zip1 polycomplex. (F) Quantification of total nuclear Zip1 intensity observed in E. Numbers of spreads are indicated for each genotype. (****) P-value < 0.0001, Wilcoxon test. (G) Quantification of DAPI-positive spreads showing a polycomplex. At least 200 spreads were considered for each condition. Values are percentage of cells ± SD of the proportion. (H) Ecm11 SUMOylation in the indicated strains analyzed by Western blot. Quantification is from two independent experiments, with the mean ratio ± SD of SUMOylated versus total Ecm11 protein indicated.

