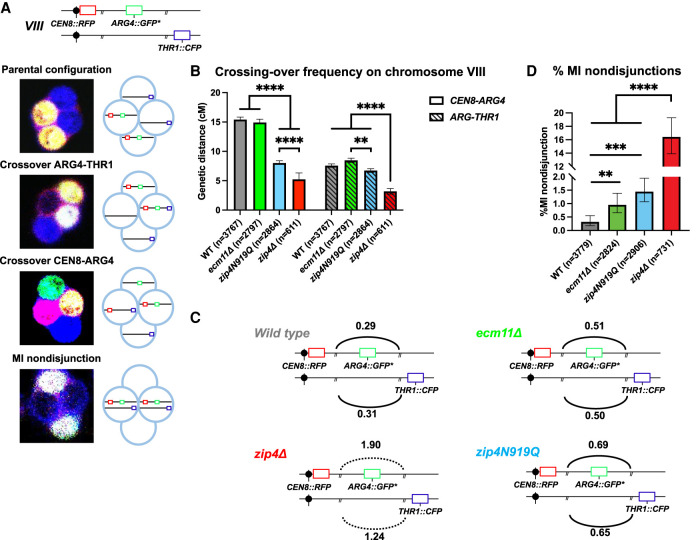
Figure 4.
The effect of the different mutations on meiotic recombination and chromosome segregation. (A) Illustration showing the location of the spore-autonomous reporters on chromosome VIII and the types of tetrads analyzed (Thacker et al. 2011). (B) Crossing-over frequency measured in two genetic intervals—CEN8-ARG4 and ARG4-THR1—on chromosome VIII. Genetic distances are plotted as cM ± SE for the indicated genotypes. (**) P-value < 0.01, (****) P-value < 0.0001, G-test. (C) Interference between the two adjacent CEN8-ARG4 and ARG4-THR1 intervals, calculated based on Malkova et al. (2004), for the indicated genotypes. The solid line indicates that significant interference was observed (P-value < 0.05, G-test). The dotted line indicates the absence of significant interference. (D) MI nondisjunction of chromosome VIII assessed by the spore-autonomous fluorescent reporter assay (see A). The percentage of MI nondisjunction ± 95% CI is plotted. (**) P-value < 0.01, (***) P-value < 0.001, (****) P-value < 0.0001, Fisher's exact test. See also Supplemental Table S1.

