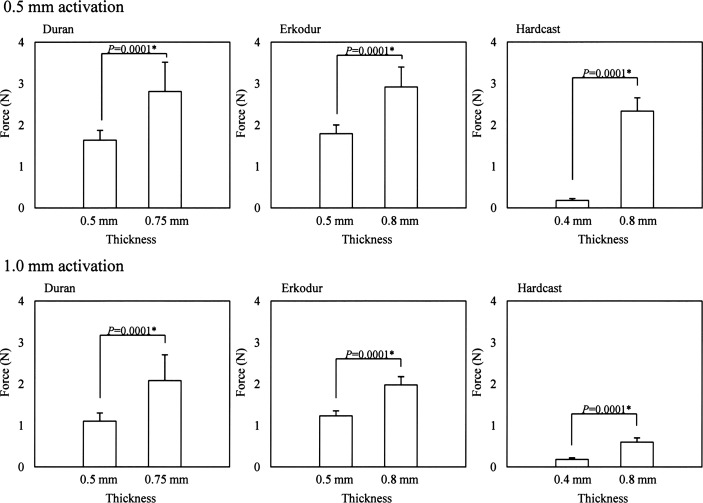
Figure 7.
Mean forces from thermoplastic appliances with standard deviations. Comparisons are presented for each material at two different thicknesses. Upper row shows results for 0.5-mm activation; lower row shows results for 1.0-mm activation (Table 1). * P < .05 by Student's t-test. Appliances fabricated from thicker materials delivered greater forces.

