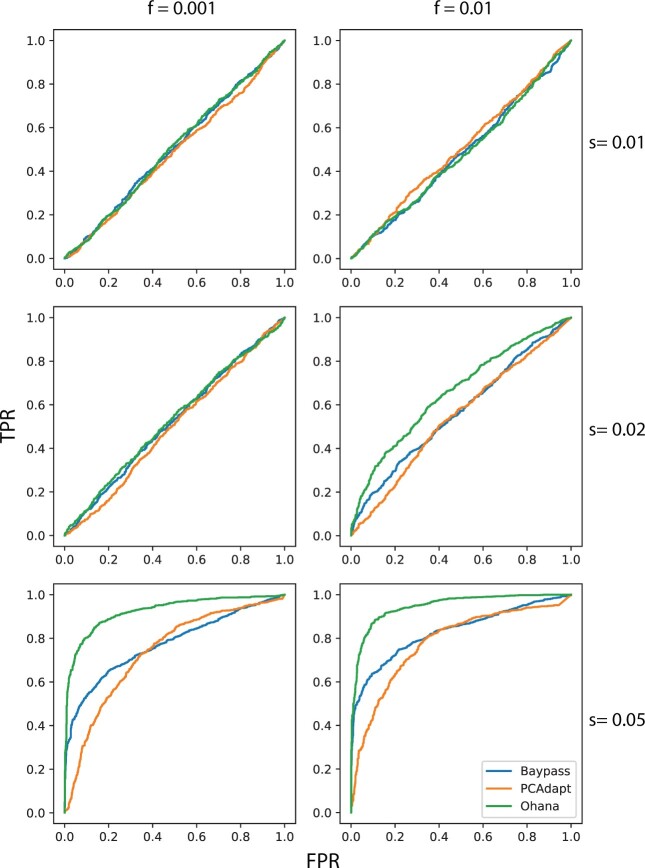
Fig. 3.
ROC curves for Ohana versus state-of-the-art methods, assessed using simulations with various values of the initial allele frequency at the beginning of selection (f) and different selection coefficients (s). Here the demographic model used was our human model (with selection in the Native American lineage), versus other demographic models considered (i.e., basic tree without and with admixture, supplementary figs. S1 and S2, Supplementary Material online, respectively).

