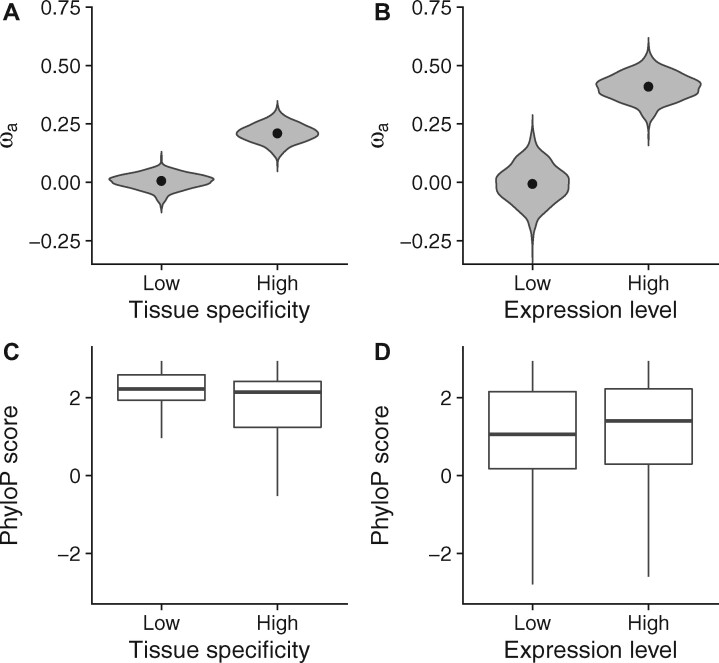
Fig. 4.
Statistical matching analysis. (A) Estimates of in 369 highly expressed genes with low tissue specificity and 368 highly expressed genes with high tissue specificity. (B) Estimates of in 498 tissue-specific genes with a low expression level and 495 tissue-specific genes with a high expression level. In each violin plot, dots indicate point estimates of while violins depict the distributions of from a gene-based bootstrapping analysis with 1,000 resamplings. (C) Distributions of phyloP scores in 369 highly expressed genes with low tissue specificity and 368 highly expressed genes with high tissue specificity. (D) Distributions of phyloP scores in 498 tissue-specific genes with a low expression level and 495 tissue-specific genes with a high expression level. In each box plot, the bottom, the top, and the middle horizontal bar of the box indicate the first quartile, the third quartile, and the median of phyloP scores, respectively. The whiskers indicate 1.5-fold interquartile ranges.

