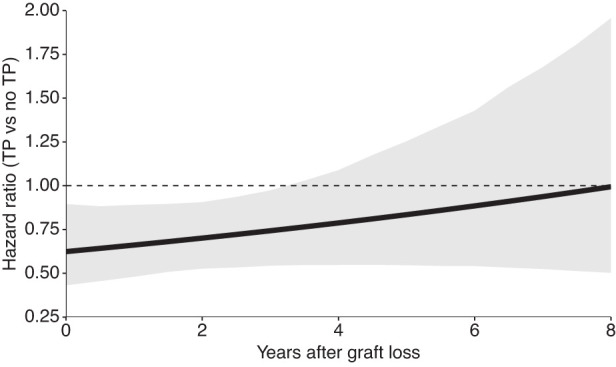
Figure 2.

Hazard ratio comparing the effect of the treatment strategies “retransplant” versus “never retransplant—remain on the waiting list with continued dialysis” on mortality, conditional on the waiting time in years elapsed since first graft loss. The hazard ratio was estimated using Cox proportional hazards models incorporating stabilized inverse probability of treatment and stabilized inverse probability of censoring weights. The solid line shows the estimate using a single model fit on the full target trial dataset, and gray bands indicate 95% confidence intervals obtained by 1000 bootstrap resamples. The dashed line presents a hazard ratio of unity (no difference) for reference. TP, retransplant; no TP, never retransplant.
