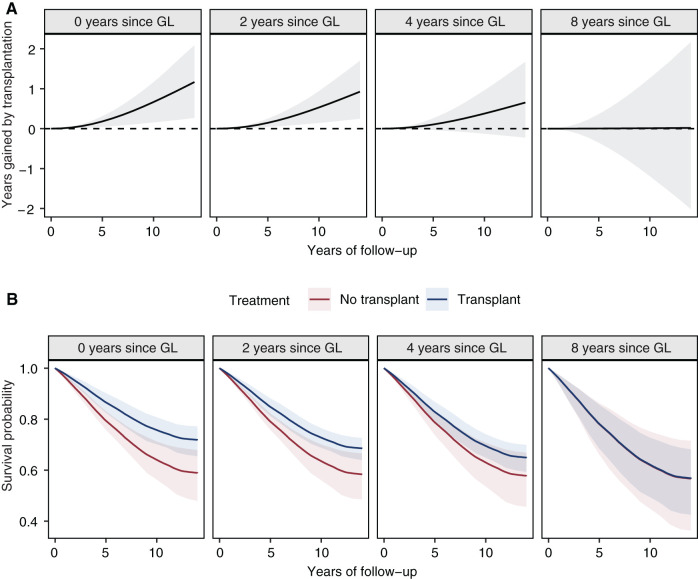
Figure 3.
Treatment comparison in terms of survival time outcomes. (A) The restricted mean survival time (RMST) difference estimated from the weighted Cox proportional hazards model also shown in Figure 2. Each subpanel gives the RMST of the transplantation group minus the RMST for the control group with up to 15 years of follow-up (x axis), conditional on the waiting time in years elapsed since first graft loss (GL). (B) The corresponding estimated adjusted survival curves for both groups in an analogous manner. The difference in RMST in (A) is given by the difference in the area under both survival curves up until a specified time of follow-up and is an estimate of the average difference in life years when the two populations are followed for a certain amount of time. In both (A) and (B), the point estimates were obtained using a single model fit on the full target trial dataset; the shaded areas indicate 95% confidence intervals obtained by 1000 bootstrap resamples.

