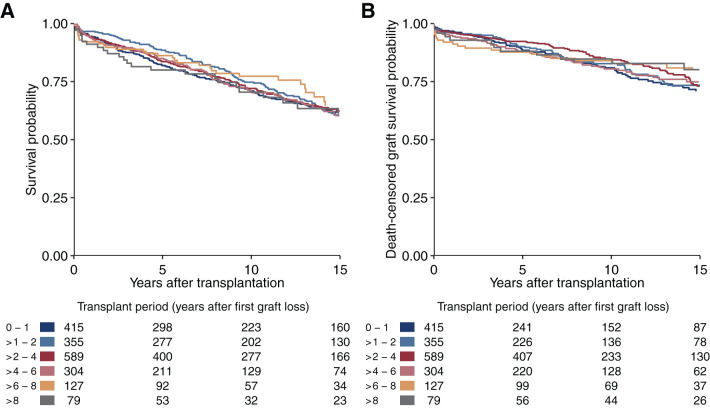
Figure 4.
Patient survival and death-censored graft survival. Kaplan–Meier plots for (A) patient survival and (B) death-censored graft survival after retransplantation, stratified by waiting time after first graft loss. Data are only shown for up to 15 years of follow-up after retransplantation. This figure is on the basis of the 1869 individuals who had a second transplantation during follow-up.

