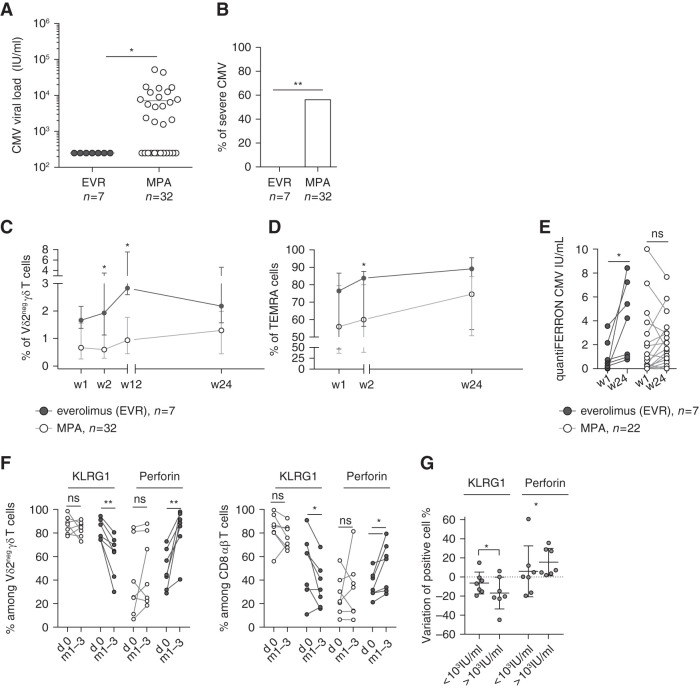
Figure 3.
Better response of T cells in patients treated with mTORis than in those treated with MPA correlated with a lower severity of CMV infection. (A) Maximal CMV viral load (IU/ml) in patients treatd with mTORis (n=7) and MPA (n=32). Each symbol represents the CMV viral load value for an individual patient; large horizontal lines indicate the mean. (B) Proportion of patients treated with MPA (n=38) and mTORis (n=7) who experienced CMV DNAemia. *P<0.05, as determined by the Fisher exact test. (C and D) Whole blood staining of Vδ2neg γδ T cells and their expression of CD27 and CD45RA. Proportion of (C) Vδ2neg γδ T cells among T cells and of (D) TEMRA (CD27neg CD45RA+) among Vδ2neg γδ T cells at week 1, 2, 12, and 24 post-transplantation in patients treated with mTORis (n=7) and MPA (n=32). Each symbol represents the median (interquartile range) value for each group of patients. (E) QuantiFERON-CMV (IU/ml) at week 1 and week 24 in patients treated with mTORis (n=7) and MPA (n=22) who experienced CMV DNAemia post-transplantation. Each symbol represents an individual donor. (F) Proportions among Vδ2neg γδ T cells (left) and among total CD8+ T cells (right) of perforin+ and KLRG1+ cells, compared between day 0 and during CMV DNAemia (either month 1 or month 3) in patients treated with mTORis (n=7) and MPA (n=7). Each symbol represents an individual donor. (G) Difference of KLRG1 and perforin+ Vδ2neg γδ T-cell percentages between month 1 and day 0 were calculated and compared in patient groups with a post-transplantation CMV viral load ≥1000 IU/ml. *P<0.05, **P<0.01, as determined for paired data by the Wilcoxon test and for unpaired data by Mann–Whitney U test.

