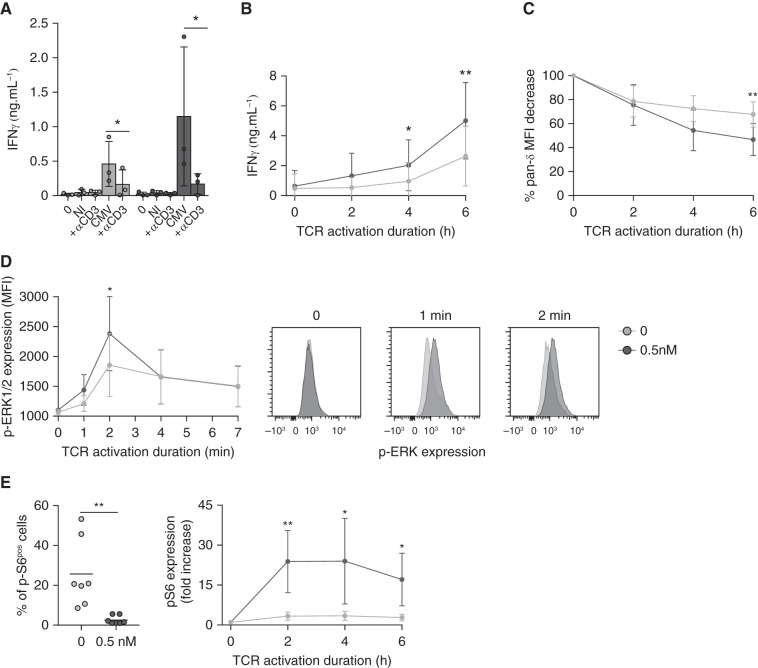
Figure 7.
TCR engagement and signaling of Vδ2neg γδ T cells are improved by mTORi. (A) Vδ2neg γδ T cells were purified and cultured in medium alone, with NI or CMV-infected fibroblasts, with or without a blocking anti-CD3 mAb (10 µg/ml) for 24 hours, and ELISA for IFNγ was performed (n=4 donors). (B) Vδ2neg γδ T cells among the total PBMCs were specifically stimulated via their TCR by an anti-Vδ1 mAb (10 µg/ml), for 2, 4, and 6 hours, and then ELISA for IFNγ was performed, and (C) cells were stained for γδ TCR downregulation analysis by flow cytometry (n=4 donors). (D) Vδ2neg γδ T cells were purified and stimulated with an anti-CD3 antibody (UCHT1, 10 µg/ml) for 0, 1, 2, 4, and 7 minutes. Erk 1/2 phosphorylation was measured by flow cytometry (one representative donor, right; in four donors, left). (E) Vδ2neg γδ T cells among the total PBMCs were specifically stimulated via their TCR by an anti-Vδ1 mAb (10 µg/ml) for 2, 4, and 6 hours, and S6 phosphorylation was measured by flow cytometry. Basal levels before stimulation are represented for seven donors (left), and activation kinetics normalized to the basal level for each condition (0 and 0.5 nM EVR) (right) for four donors are represented. Each symbol represents an individual donor, large horizontal lines indicate the mean and small horizontal lines indicate the SD in (A) and (E, left). Each symbol represents the median of the results for four donors, and the small horizontal lines represent the ranges in (B), (C), (D), and (E, right). *P<0.05, **P<0.01, as determined by the Wilcoxon test.

