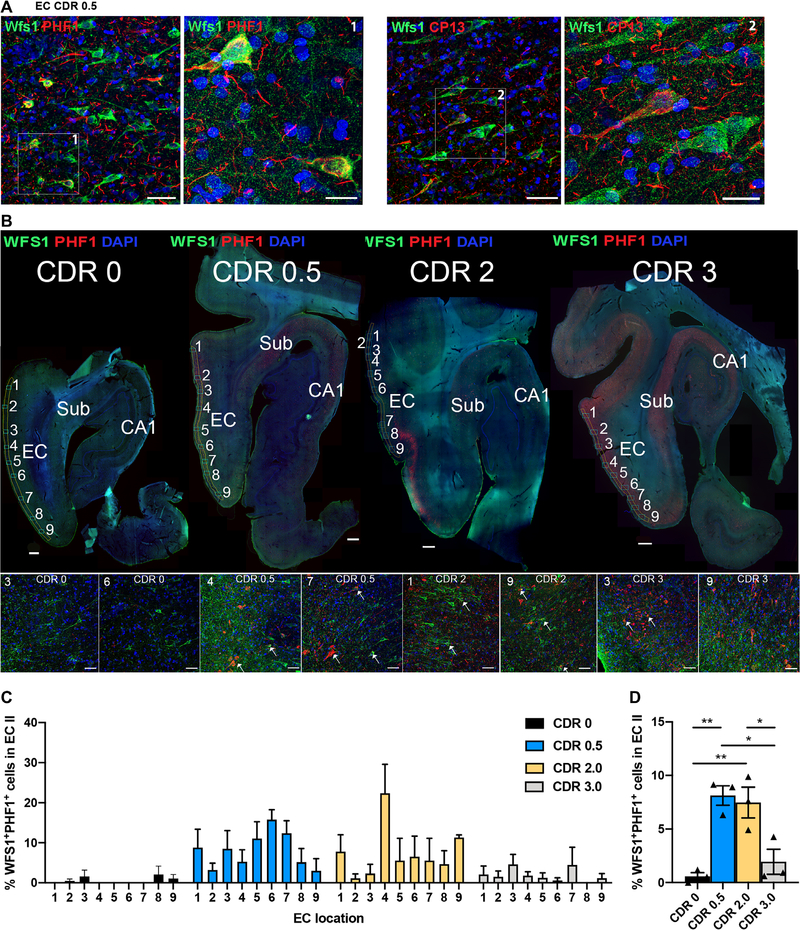
Fig. 1. PHF1 antibody binding to WFS1+ neurons in human AD postmortem brain samples.
(A) Shown is a horizontal section of human postmortem brain tissue from a patient with early stage AD [Clinical Dementia Rating (CDR) score 0.5, Braak stage III; table S1] showing the entorhinal cortex (EC) and WFS1+ neurons (green) in layers II and III. Phosphorylated tau (p-tau), detected by PHF1 antibody (left, red) or CP13 antibody (right, red), is present in a few WFS1+ neurons. Scale bars, 50 μm for 20× images in large panels and 20 μm for enlarged 63× images. (B) Shown are horizontal sections of postmortem human brain tissue from four patients (CDR 0, Braak Stage I, 85-year-old male; CDR 0.5, Braak stage III, 85-year-old male; CDR 2, Braak stage III, 88-year-old female; CDR 3, Braak stage V, 85-year-old male), with the EC and hippocampal CA1 areas indicated. Sections were immunostained with anti-WFS1 antibody (green) and PHF1 antibody (red). Sub, subiculum. The numbers 1 to 9 reflect the EC images used for quantification. Insets (bottom row) represent two examples of EC images per CDR group, and white arrows in insets indicate WFS1-PHF1 colocalization. Scale bars, 1000 μm for top panel images and 50 μm for bottom row inset images. (C) Shown is the distribution pattern of WFS1+PHF1+ neurons across the EC region of postmortem brain samples from 3 controls and 9 patients at various stages of AD with CDRs of 0, 0.5, 2, or 3 (12 patients total, n = 3 per CDR group; tables S1 and S2). (D) Quantification of WFS1+PHF1+ neurons in the EC upper layer of postmortem brain samples from 3 controls and 9 patients at various stages of AD with CDRs of 0, 0.5, 2, or 3, 12 patients total, n = 3 per CDR group [one-way ANOVA, F(3,8) = 13.43 **P < 0.01; Tukey’s post hoc, test *P < 0.05 and **P < 0.01; tables S1 and S2].

