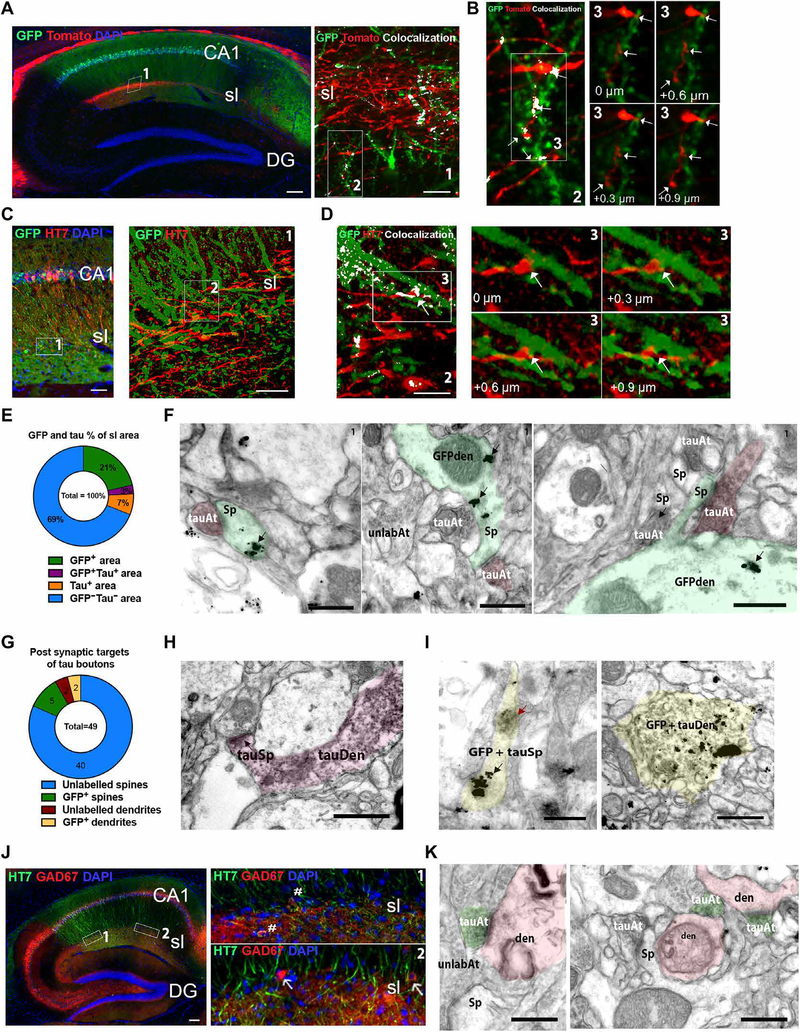
Fig. 3. Wfs1+ neurons connected to stratum lucidum interneurons and CA1 pyramidal neurons propagate tau to mouse hippocampal CA1.
(A) Left: Shown is a representative parasagittal section of the CA1 hippocampal region of Wfs1-Cre mouse brain injected unilaterally with AAV2/6-Flex-tdTomato (red) into the MEC and AAV2/6-Flex-GFP (green) injected unilaterally into the CA1. Brain sections were immunostained with anti-RFP/anti-GFP antibodies and were visualized by epifluorescence. Scale bar, 100 μm (n = 10 sections from 8 animals). (A) Right: High-resolution confocal microscopy of the CA1 stratum lacunosum (sl) (box 1; scale bar, 5 μm). (B) Left: Shown is a representative maximum projection of confocal image stacks showing colocalization of GFP and tdTomato immunostaining (white) in stratum lacunosum (sl). Scale bar, 5 μm. (B) Right: Single optical planes of the inset (left, box 3) show examples of appositions (white arrows) between GFP+ dendrites and tdTomato+ axons. (C) Left: Shown is a parasagittal section from the hippocampal region of Wfs1-Cre mouse brain injected with AAV2/6-Flex-P301L mutant tau unilaterally into the MEC and AAV2/6-Flex-GFP injected unilaterally into the hippocampal CA1 region. Sections were immunostained with anti-human tau HT7 antibody (red) and anti-GFP antibody (green) and were visualized by epifluorescence. Scale bar, 50 μm (n = 10 sections from 6 animals). (C) Right: High-resolution confocal microscopy image of the CA1 stratum lacunosum (sl) in box 1, left. Scale bar, 10 μm. (D) Left: Representative maximum projection of confocal image stacks of box 2 in Fig. 2C, right panel showing GFP (green) and tau (red) colocalization (white) in CA1 stratum laconosum. Scale bar, 5 μm. (D) Right: Single optical planes of the inset image (box 3, left) are shown in the four right panels and indicate examples of appositions (white arrows) between GFP+ spines and dendrites and tau+ axon terminals. (E) Quantification of the area labeled with GFP or tau or both in CA1 stratum lacunosum by confocal microscopy (two to five sections from 6 animals). (F) Electron micrographs of the Wfs1-Cre mouse brain CA1 stratum lacunosum showing examples of synaptic contacts between diaminobenzidine+ tau axon terminals (tauAt, pink overlay) and GFP immunogold+ spines (Sp, black arrows, green overlay) on GFP immunogold + dendrites (GFPden). Note the appearance of the diaminobenzidine+ tau–labeled axons compared to unlabeled axon terminals (unlabAt) nearby (n = 3 animals). (G) Quantification of the postsynaptic targets of tau boutons in stratum lacunosum measured by immunoelectron microscopy (pooled from n = 2 animals). (H) Representative electron micrograph of Wfs1-Cre mouse brain CA1 stratum lacunosum showing an example of a dendritic spine labeled with diaminobenzidine+ tau, emerging from a parent dendrite labeled with diaminobenzidine+ tau. Scale bar, 0.5 μm. (I) Electron micrographs of the CA1 stratum lacunosum showing an example of a dendritic spine (left) and a dendrite (right) double-labeled with both GFP immunogold (black arrow) and diaminobenzidine+ tau (red arrow). Scale bars, 0.5 μm. (J) Shown is a representative parasagittal section of the hippocampus of Wfs1-Cre mouse brain injected unilaterally with AAV2/6-Flex-P301L mutant tau into the MEC and immunostained by anti-human tau HT7 antibody (green) and anti-GAD67 antibody (red). White hash symbols indicate tau-positive GAD67 interneurons, and white arrows indicate tau-negative GAD67 interneurons. Scale bar, 100 μm (n = 6 sections from 4 animals). (K) Shown are electron micrographs of the Wfs1-Cre mouse brain CA1 stratum lacunosum region indicating an example of tau axon terminals (green) forming synapses on spiny dendrites (pink). Scale bars, 0.5 μm (table S2).

