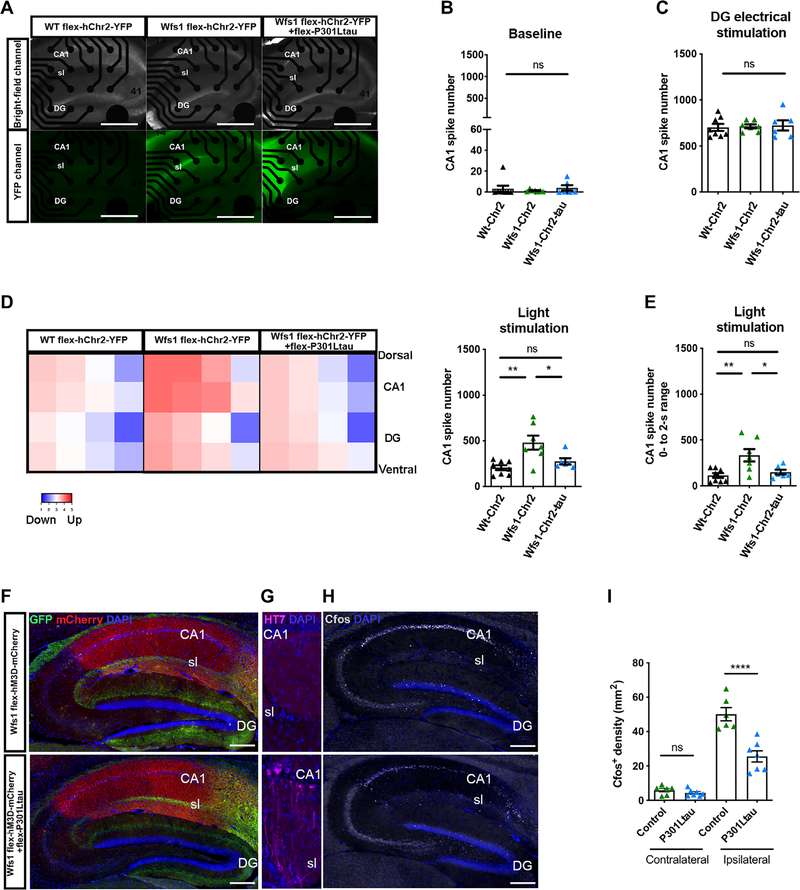
Fig. 4. Tau propagation modulates mouse hippocampal CA1 response to optogenetic and pharmacologic stimulation.
(A) Top row of photomicrographs show bright field images of wild-type (WT) or Wfs1-Cre mouse brain hippocampal slices 4 weeks after injection of a Cre-dependent channelrhodopsin-2 (Chr2) with or without Cre-dependent P301L mutant tau expression, positioned on a multielectrode array. Bottom row of photomicrographs show visualization of YFP in hippocampal slices from wild-type and Wfs1-Cre mouse brains 4 weeks after injection of a Cre-dependent Chr2 with or without Cre-dependent P301L mutant tau expression. Scale bars, 100 μm. (B) Shown is baseline neuronal activity in the hippocampal CA1 slices measured by multielectrode array 4 weeks after the injection of a Cre-dependent Chr2 with or without Cre-dependent P301L mutant tau expression in wild-type and Wfs1-Cre mouse brains [one-way ANOVA, F(2,18) = 0.33, Wt-Chr2 group: n = 8 animals; Wfs1-Chr2 group: n = 7 animals; Wfs-Chr2-tau group: n = 6 animals]. (C) Shown is hippocampal CA1 slice neuronal activity measured by multielectrode array after dentate gyrus electrical stimulation, 4 weeks after the injection of a Cre-dependent Chr2 with or without Cre-dependent P301L mutant tau expression in wild-type and Wfs1-Cre mouse brains [one-way ANOVA, tau effect F(2,18) = 0.08, Wt-Chr2 group: n = 8 animals; Wfs1-Chr2 group: n = 7 animals; Wfs-Chr2-tau group: n = 6 animals]. (D) Left: Shown is a heatmap representing the degree of hippocampal CA1 activation in response to light stimulation of YFP- and Chr2-expressing axons in hippocampal slices, 4 weeks after the injection of a Cre-dependent Chr2 with or without Cre-dependent P301L mutant tau expression in wild-type or Wfs1-Cre mouse brains. (D) Right: Quantification of CA1 neuronal activity after light activation of YFP-expressing channelrhodopsin axons in hippocampal slices during the total 20 s of recording after light stimulation [one-way ANOVA, tau effect F(2,18) = 8.30 **P < 0.01; Tukey’s post hoc, *P < 0.05 and **P < 0.01. Wt-Chr2 group: n = 8 animals; Wfs1-Chr2 group: n = 7 animals; Wfs-Chr2-tau group: n = 6 animals]. (E) Quantification of CA1 neuronal activity after light activation of YFP and Chr2-expressing axons in hippocampal slices during only the first 2 s after light stimulation [one-way ANOVA, tau effect F(2,18) = 7.19 **P < 0.01; Tukey’s post hoc, *P < 0.05 and **P < 0.01. Wt-Chr2 group: n = 8 animals; Wfs1-Chr2 group: n = 7 animals; Wfs-Chr2-tau group: n = 6 animals]. (F to H) Shown is a representative parasagittal section of Wfs1-Cre mouse brain injected unilaterally with AAV.PHP.eB-Flex-hM3D-mCherry (DREADDs activator) into the hippocampal CA1 region and AAV2/6-Flex-P301L mutant tau or AAV2/6-Flex-GFP injected unilaterally into the MEC. Four weeks after viral vector injection and 90 min after intraperitoneal injection of clozapine at 0.3 mg/kg, hippocampal CA1 sections were immunostained with (F) anti-mCherry antibody (red) and anti-GFP antibody (green); (G) anti-human tau HT7 antibody and (H) anti–c-fos antibody. Scale bars, 200 μm. (I) Quantification of c-fos staining in (H) for the contralateral (internal control for clozapine) and ipsilateral sides [two-way ANOVA, interaction effect F(1,22) = 19.86; Tukey’s post hoc, ****P < 0.0001; ns, not significant; control: n = 6 animals; P301L mutant tau: n = 7 animals].

