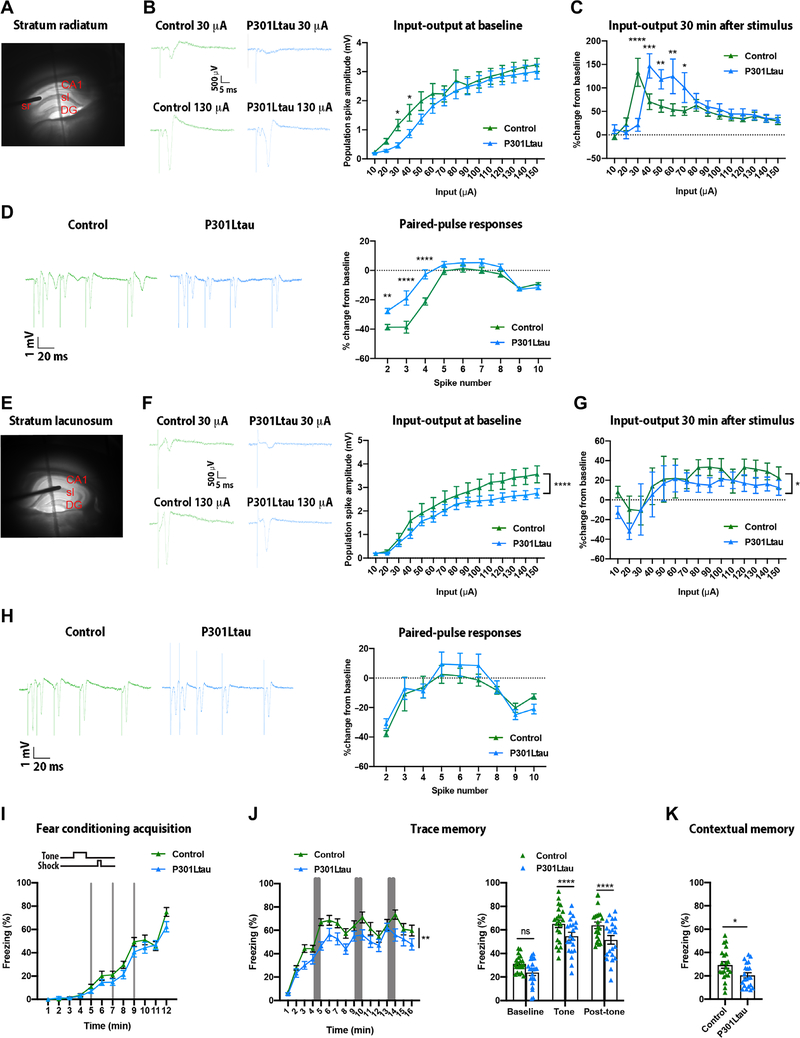
Fig. 5. Effects of tau propagation in mouse hippocampal CA1 on neuronal excitability and behavior.
(A) Photomicrograph of a hippocampal slice from a Wfs1-Cre mouse brain showing location of the stimulating electrode in the stratum radiatum (sr) and recording electrode in the stratum pyramidale (CA1). (B) Left: Shown are representative field potential responses of hippocampal CA1 slices to 30 and 130 μA of stimuli in the stratum radiatum for control and P301L mutant tau mouse brains. (B) Right: Shown are mean input (tetanic stimulus) and output (response) plots for hippocampal slices of wild-type control mice and P301L mutant tau mice [two-way ANOVA, tau effect F(1,292) = 9.80, ***P < 0.001, Fisher’s least significance difference post hoc test *P < 0.05, control: n = 12 animals; P301L mutant tau: n = 10 animals]. (C) Mean change in population spike amplitude in response to a tetanic stimulus in hippocampal slices of wild-type control and P301L mutant tau mice 30 min after stimulation [two-way ANOVA, interaction effect F(14,295) = 4.07, ****P < 0.0001; Fisher’s least significance difference post hoc test, *P < 0.05, **P < 0.01, ***P < 0.001, and ****P < 0.0001; control: n = 12 animals; P301L mutant tau: n = 10 animals]. (D) Left: Representative paired pulse responses for hippocampal slices of wild-type control mice compared to P301L mutant tau mice. (D) Right: Shown is a plot of percent change in responses compared to the first stimulus of a series of nine interspike intervals (10 stimuli in total) for hippocampal slices of wild-type control mice compared to P301L mutant tau mice [two-way ANOVA, interaction effect F(8,180) = 5.25 ****P < 0.0001; Fisher’s least significance difference post hoc test, **P < 0.01 and ****P < 0.0001; control: n = 12 animals; P301L mutant tau: n = 10 animals]. (E) Photomicrograph of a hippocampal slice showing the location of the stimulating electrode in the stratum lacunosum and the recording electrode in the CA1. (F) Left: Shown are representative field potential responses of hippocampal CA1 slices of wild-type control and P301L tau mouse brains to 30 and 130 μA of stimuli of the stratum lacunosum. (F) Right: Shown is the mean input (tetanic stimulus) and output (response) plots for wild-type control compared to P301L mutant tau mice [two-way ANOVA, tau effect F(1,293) = 19.43, ****P < 0.0001; control: n = 12 animals; P301L mutant tau mice: n = 10 animals]. (G) Shown is the mean change in population spike amplitude in response to a tetanic stimulus in wild-type control compared to P301L mutant tau mice 30 min after the stimulus [two-way ANOVA, tau effect F(1,266) = 4.49, *P < 0.05; control: n = 12 animals; P301L mutant tau mice, n = 10 animals]. (H) Left: Shown are representative paired pulse responses in hippocampal slices from wild-type control and P301L mutant tau mice. (H) Right: Shown is a plot of percent change in responses in hippocampal slices compared to the first stimulus of a series of nine interspike intervals (10 stimuli total) for wild-type control and P301L mutant tau mice [two-way ANOVA, tau effect F(1,197) = 0.90, not significant, Fisher’s least significance difference post hoc test, n = 11 to 14 slices per group]. (I) Shown is a time course of freezing in the fear conditioning test during training on day 1 observed in control mice and in Wfs1-Cre mice after injection of an AAV vector carrying P301L human mutant tau into the MEC [two-way ANOVA on repeated measures, tau effect F(1,41) = 3.56, not significant; control: n = 22 animals; P301L mutant tau: n = 21 animals]. (J) Shown is trace memory on day 2 of the fear conditioning test [left: two-way ANOVA on repeated measures, tau effect F(1,41) = 8.89, **P < 0.01; right: two-way ANOVA, tau effect F(1,123) = 18.24, ****P < 0.0001, Sidak post hoc test, control: n = 22 animals; P301L mutant tau mice: n = 21 animals]. (K) Shown is testing of contextual memory on day 3 of the fear conditioning test (unpaired t test, t = 2.491, *P < 0.05; control: n = 22 animals; P301L mutant tau mice: n = 21 animals). See table S2 for sample details for (C) to (E) and (G) to (L).

