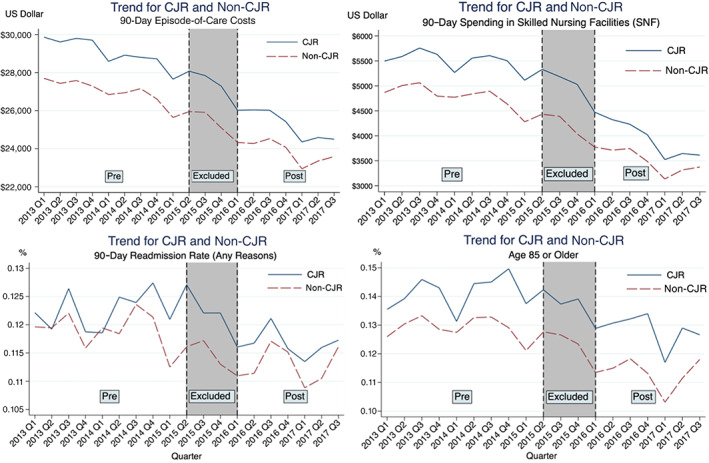
FIGURE 1.

Pretrend graph between CJR hospitals and non‐CJR hospitals on 90‐day episode‐of‐care costs, 90‐day spending in skilled nursing facilities, 90‐day readmission rate for any reasons, and age 85 years or older. “Pre” means prepolicy periods and “post” means postpolicy periods. “Excluded” represent the periods from July 2015 to April 2016. The US dollar value is adjusted to 2017‐dollar value [Color figure can be viewed at wileyonlinelibrary.com]
