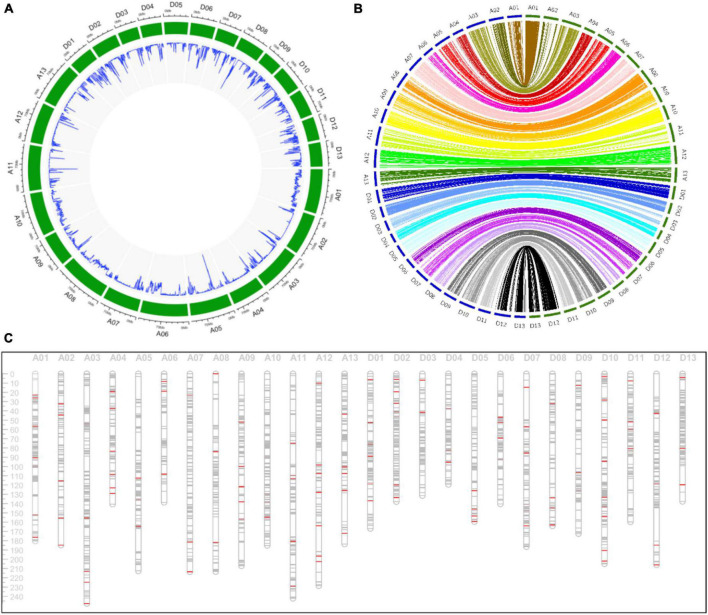
FIGURE 2.
Detailed information about the genetic linkage map. (A) The density of SNP markers in the G. hirsutum genome in a 500 Kb window. (B) The collinearity analysis of markers between the genetic map and the physical map. The blue circle and the green circle indicating the genetic map and the physical map, respectively. (C) The distribution of markers in the genetic map. The gray lines and the red lines indicating SNP and SSR markers, respectively.

