. 2021 Oct 14;18(1):31–44. doi: 10.1039/d1mo00236h

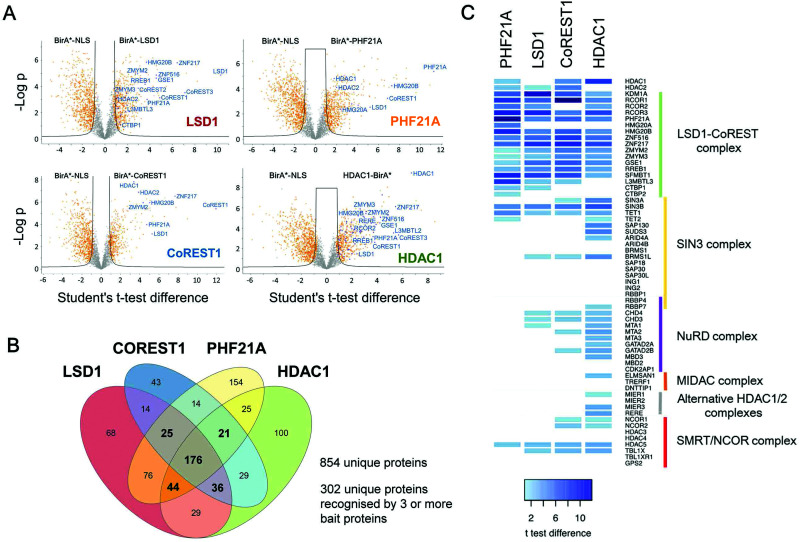
Fig. 2. Identification of CoREST complex proximal proteins. (A) Volcano plots of LFQ data from BirA-tagged bait proteins versus the BirA-NLS control are shown. Two levels of stringency for the Student's t-test were utilised based on the S0 parameter in Perseus which controls the relative importance of a t-test p value and difference between the means; S0 = 1, a lower stringency level (orange squares), and S0 = 2 a higher stringency level (solid black lines). All subsequent analysis was performed on proteins significantly enriched in the higher stringency analysis. Previously known interacting proteins (as determined from BioGRID67) are highlighted (blue squares) and components of the CoREST complex labelled for reference. (B) Significantly enriched proteins for each BirA*-fused CoREST complex member were determined by students t-tests at high stringency (S0 = 2). The proximal proteins for each CoREST complex component were compared and shown to overlap substantially. (C) A heat-map was plotted based on the students t-test differences (vs. BirA*-NLS) for association of class-I HDAC complexes components with the indicated CoREST components.

Fig. 2