. 2021 Oct 14;18(1):31–44. doi: 10.1039/d1mo00236h

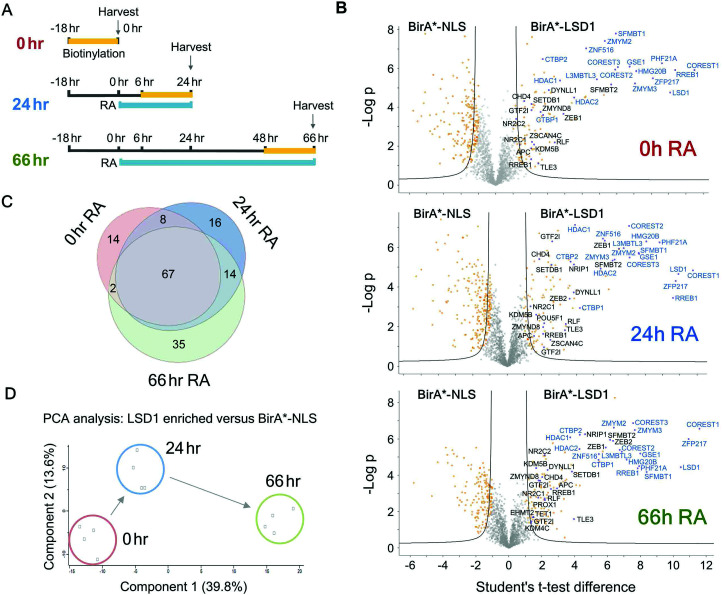
Fig. 5. ES cells were differentiated with retinoic acid (RA) to identify the temporal LSD1 interactome during differentiation. (A) Schematic diagram showing the time course for RA treatment and biotin labelling used for BioID experiments. (B) Volcano plots for the indicated time points of RA treatment. Two levels of stringency for the Student's t-test were utilised based on the S0 parameter in Perseus which controls the relative importance of a t-test p value and difference between the means; S0 = 1, a lower stringency level (orange squares), and S0 = 2 a higher stringency level (solid black lines). All subsequent analysis was performed on proteins significantly enriched in the higher stringency analysis. Previously known interacting proteins (as determined from BioGRID67) are highlighted (blue squares) and components of the CoREST complex labelled for reference. (C) Venn diagram showing proteins significantly associated with BirA*-LSD1 (S0 = 2) at the indicated time-points following RA treatment. (D) Principal component analysis (PCA) was performed on individual BirA*-LSD1 BioID experiments (n = 4) at the indicated time-points.

Fig. 5