. 2021 Oct 14;18(1):31–44. doi: 10.1039/d1mo00236h

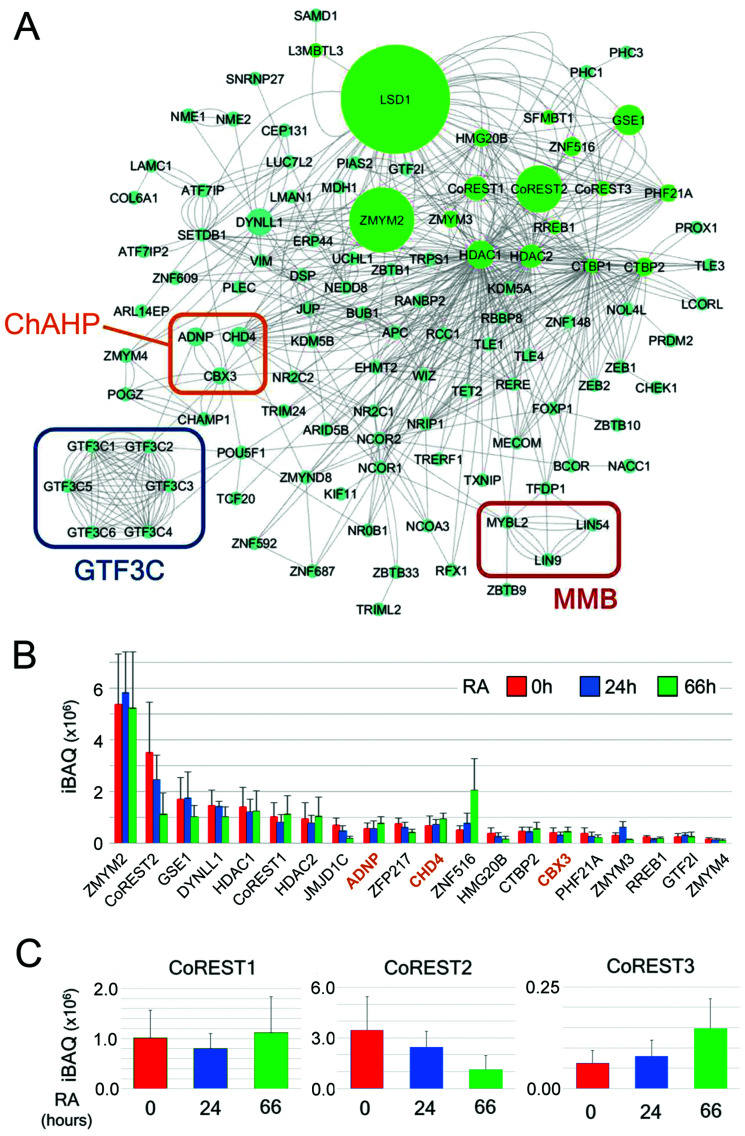
Fig. 7. LSD1-interactome network and iBAQ values reveal shifting stoichiometry of the CoREST complex. (A) Cytoscape was used to generate a network of LSD1-interacting proteins in ES cells. The intensity-based absolute quantification (iBAQ) values for individually isolated proteins is indicated by the size of the node (green circles). LSD1-associated complexes of interest, including: MMB, ChAHP and GTF3C are indicated by coloured rectangles. (B) The top 20 proteins with the highest iBAQ values are shown for each time-point of retinoic acid (RA) treatment. The three main components of the ChAHP complex are coloured in orange. All values are shown as mean ± SD (C) iBAQ values for the three CoREST homologues is shown over the time course of RA mediated differentiation.

Fig. 7