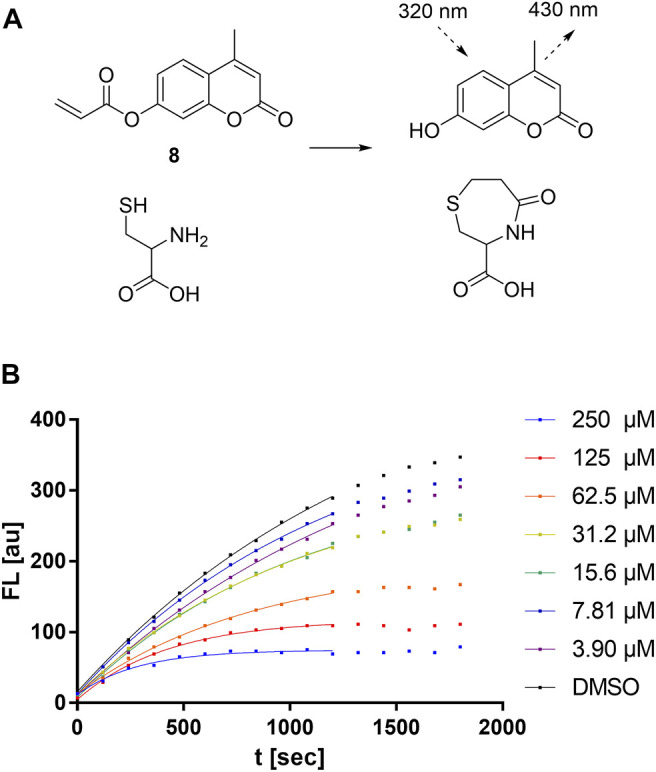
FIGURE 7.

Cysteine reactivity assay. (A) Mechanism of the fluorescent probe 8 reacting with cysteine. (B) Cysteine reactivity assay with variable concentrations of compound 5a showing hyperbolic substrate conversion plots. The fluorescence was recorded for 30 min every 30 s. For clarity, only every fourth data point is shown.
