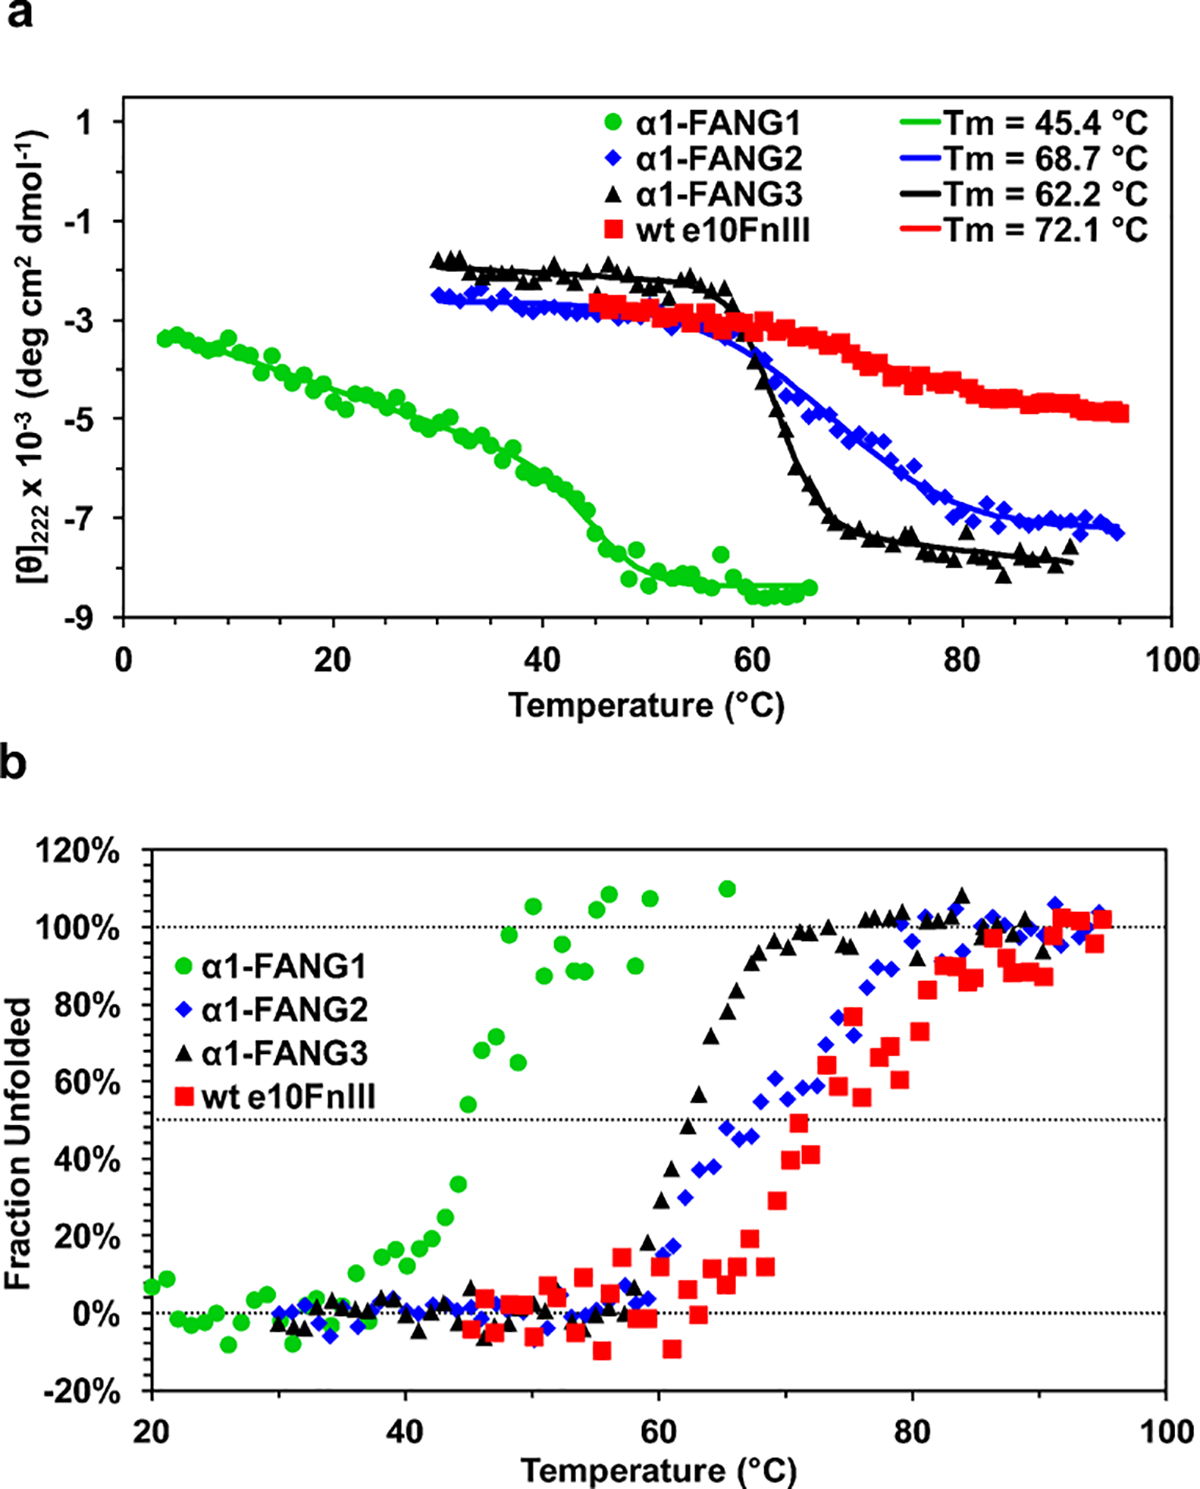
Figure 4.

Melting curves of α1-FANG ligands. (a) Melting curves for α1-FANG1, α1-FANG2, and α1-FANG3 scaffolds at θ222. α1-FANG3 shows the most defined transition between two folded states. (b) Folding curves for the clones mentioned above showing the transition from folded to unfolded states.
