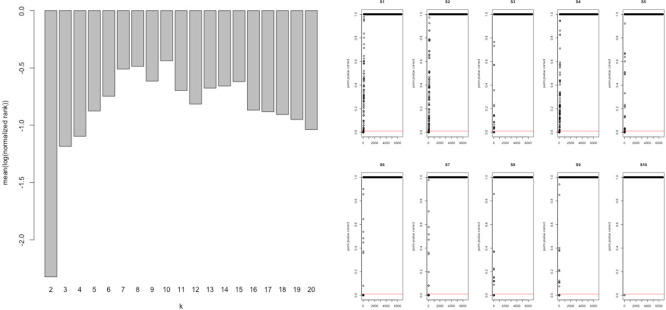
Appendix 1—figure 1. Network analysis statistics from MEGENA.
Analysis of the combined ‘disease’ insulin resistance (IR) and ‘treatment’ response IR genes using tissue gene expression data (Timmons et al., 2018; Timmons et al., 2019) identified those genes that had the greatest connectivity in tissue. These values were used to re-rank and select the top 60 upregulated (positively correlating) and 60 downregulated (negatively correlating) genes regulated in common in adipose and muscle tissue (see Methods).

