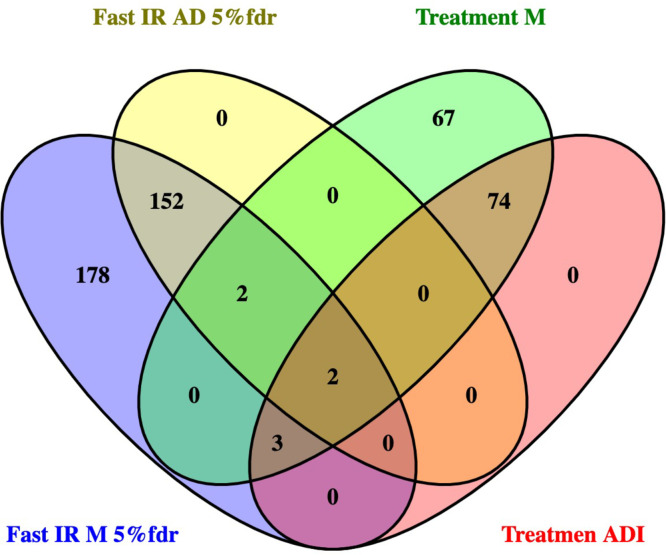
Appendix 1—figure 11. Transcripts related to HOMA2-IR, independent of donor chronological age, in muscle and adipose tissue.
Primary analysis relied on identifying RNA that tracked with HOMA2-IR in muscle as this tissue represented the largest number of independent data sets – for both fasting tissue status and response to lifestyle intervention. Thereafter the candidates identified in muscle were examined in adipose tissue. The statistical ‘significance’ of the relationship (e.g. FDR < 5%), the magnitude and direction of the linear relationship (correlation coefficient) all informed the final selection of marker genes. As can be observed, in this analysis, the fasting HOMA2-IR genes and the treatment response HOMA2-IR genes represent a largely independent pool of genes (only VCL, GSTO1, SEC31B, FERMT2, OGFOD3, CENPV and NDUFAF5 were common to both states).

