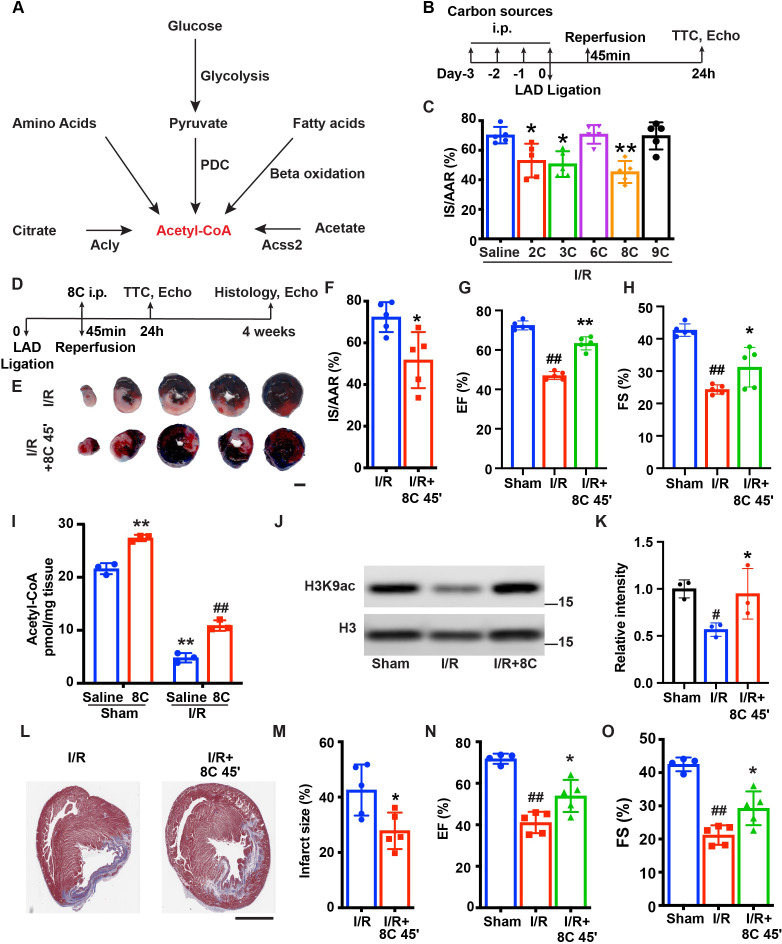
Figure 1. 8 C administration attenuates ischemia-reperfusion injury in rats.
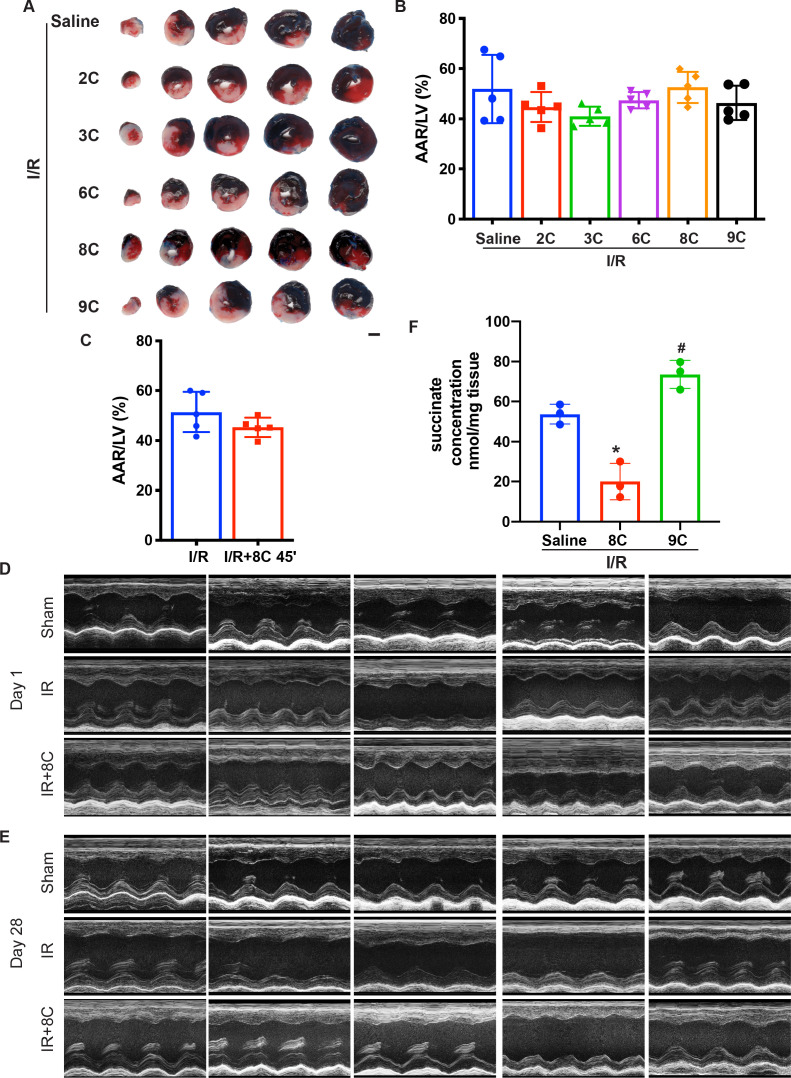
(A) Metabolic pathways of acetyl-CoA synthesis. (B) Schematic diagram of different carbon sources administration prior to I/R surgery. (C) Quantification of IS/AAR ratio in Figure 1—figure supplement 1A by Image J. (D) Schematic diagram of 8C administration post ischemic injury. (E) Representative figures of heart sections at 24 hr after I/R with or without 8C administration at reperfusion after 45 min ischemia. Scale bar: 2.5 mm (F) Quantification of IS/AAR ratio in (E). LV EF (G) and FS (H) at 24 hr after I/R. (I) Quantification of Acetyl-CoA levels in sham and I/R rat hearts at indicated conditions. (J–K) Western blot and quantification of H3K9ac and H3 in rat hearts 24 hr after I/R. (L) Trichrome masson staining of heart section after 4 weeks of I/R. Scale bar: 2.5 mm. (M) Quantification of infarct size in (I). LV EF (N) and FS (O) at 4 weeks after I/R. Error bars represent S.D. n = 5, #p < 0.05, ##p < 0.01 vs Sham group. * p < 0.05, **p < 0.01, vs I/R group. Data were analyzed by one-way ANOVA (C,G,H,K,N and O) or two-way ANOVA (I), followed by post-hoc Tukey test, data in F and M were analyzed by two-tailed student test.


