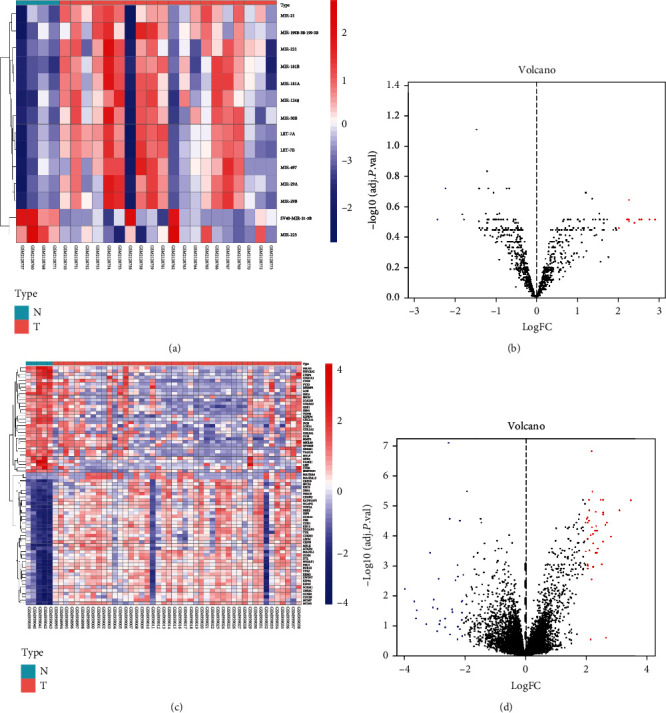
Figure 1.

Heat map and volcano map of differentially expressed genes of GSE80201 and GSE39262. (a) Heat map of DEGs in GSE80201. (b) Volcano map of DEGs in GSE80201. (c) Heat map of DEGs in GSE39262. (d) Volcano map of DEGs in GSE39262. Red dots represent upregulated genes, and blue dots represent downregulated genes.
