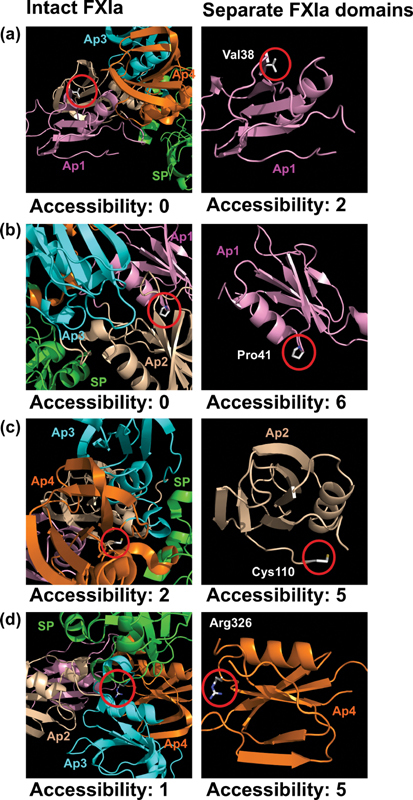
Fig. 9.

Molecular graphic representation of residues within the FXI protein structure. The left-hand panel highlights the residue of interest and its calculated solvent accessibility in the native FXI protein. The right-hand side panel shows the same residue in its respective isolated domain, with its corresponding accessibility. Panels (a), (b), (c) and (d) highlight the residues Val38, Pro41, Cys110 and Arg326 respectively. Accessibility calculations are detailed in the Methods section. The domain coloring corresponds to that in Figure 3 . All residue numbering is given in HGVS format.
