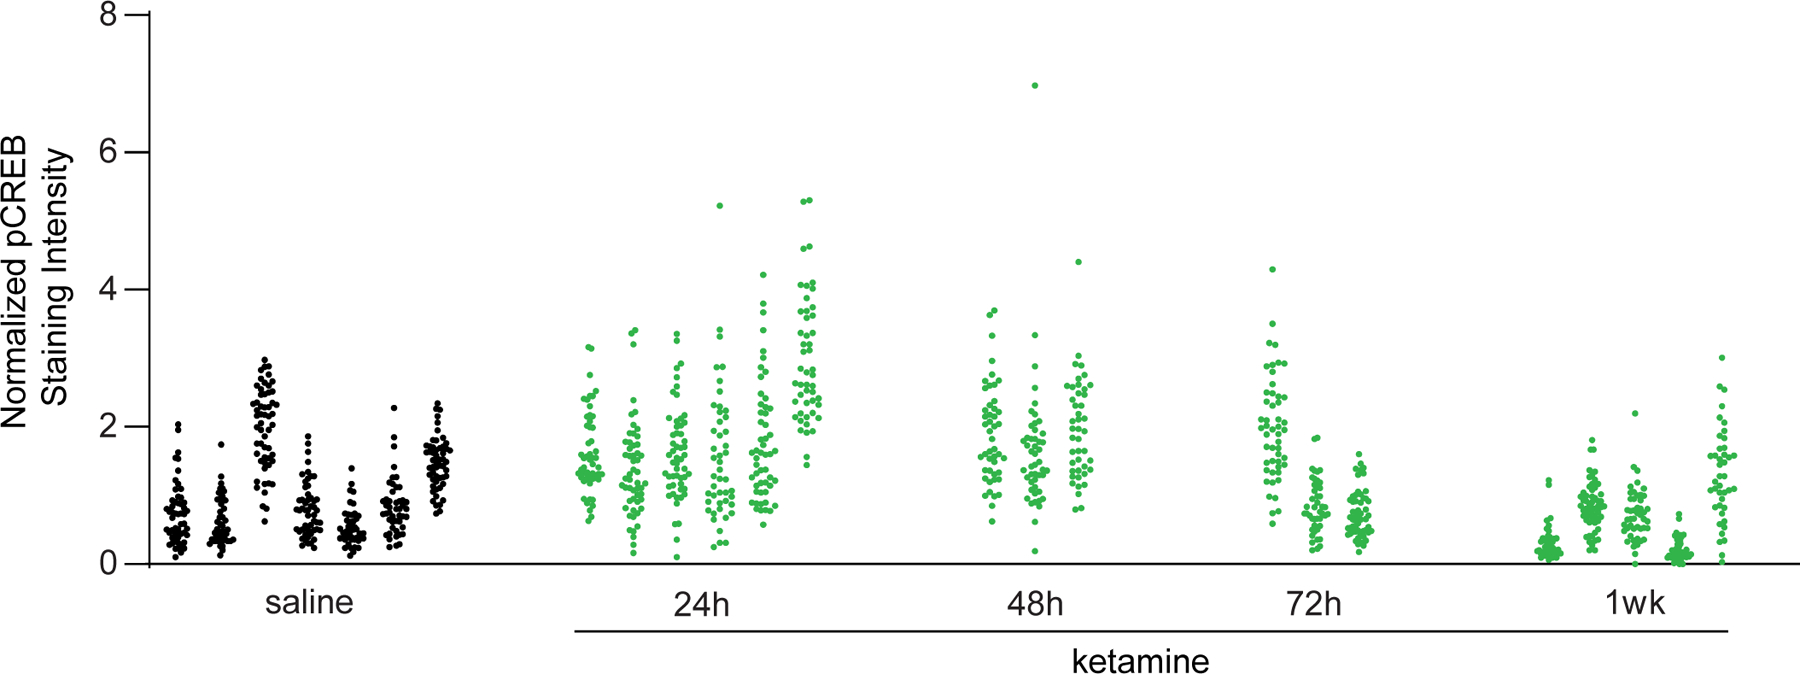
Figure 2. Avoiding false positives that arise from correlated measurements taken from the same animals.

Normalized pCREB staining intensity values from 1200 neurons (Example 1). The values in each cluster were from one animal. In total, pCREB values were measured for 1200 neurons from 24 mice at five conditions: saline (7 mice, ICC=0.61), 24h (6 mice, ICC=0.33), 48h (3 mice, ICC=0.02), 72h (3 mice, ICC=0.63), 1wk (5 mice, ICC=0.54) after treatment. According to ICC, observations at 48h and 72h show the smallest and largest intra-class correlations, respectively.
