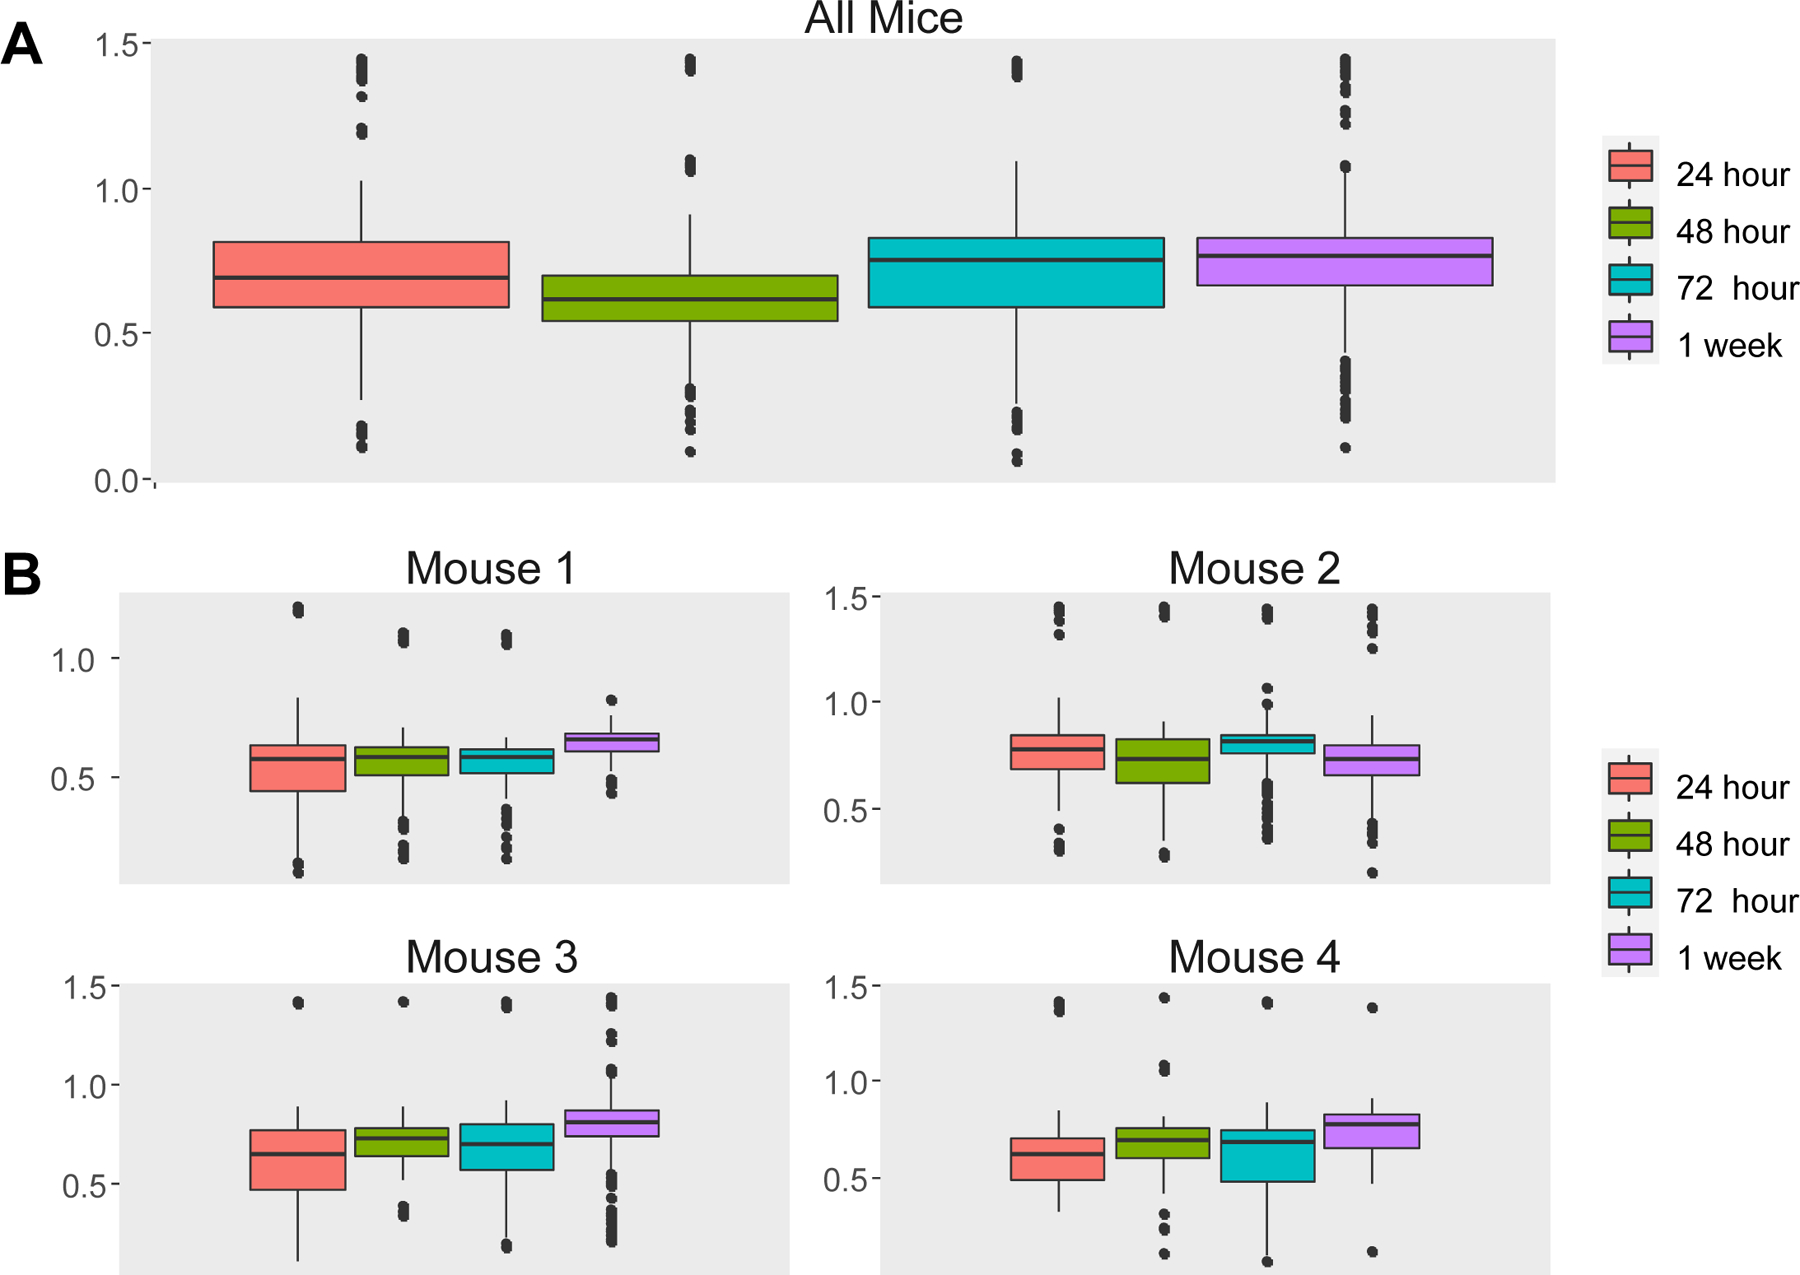
Figure 5. Weighting effects from single animals.

When data from different animals are naively pooled, the result can be dominated by the data from a single animal (Example 2). To illustrate this point, we present the boxplots of Ca++ event frequencies measured at four time points using two different ways: (A) Boxplot of Ca++ event frequencies using the pooled neurons from four mice. ANOVA or t-test showed that Ca++ activity was significantly reduced at 48h relative to 24h with p=4.8×10⁻⁶, and significantly increased Ca++ activity at 1wk compared to 24h with p=2.4×10⁻³. However, when looking at (B) boxplots of Ca++ event frequencies stratified by individual mice, these changes occur only in mouse 2. This is because Mouse 2 contributed 43% cells, which likely explains why the pooled data are more similar to Mouse 2 than to other mice. Note that the comparisons are not significant if we account for repeated measures due to cells clustered in mice using LME, thus avoiding an erroneous conclusion.
