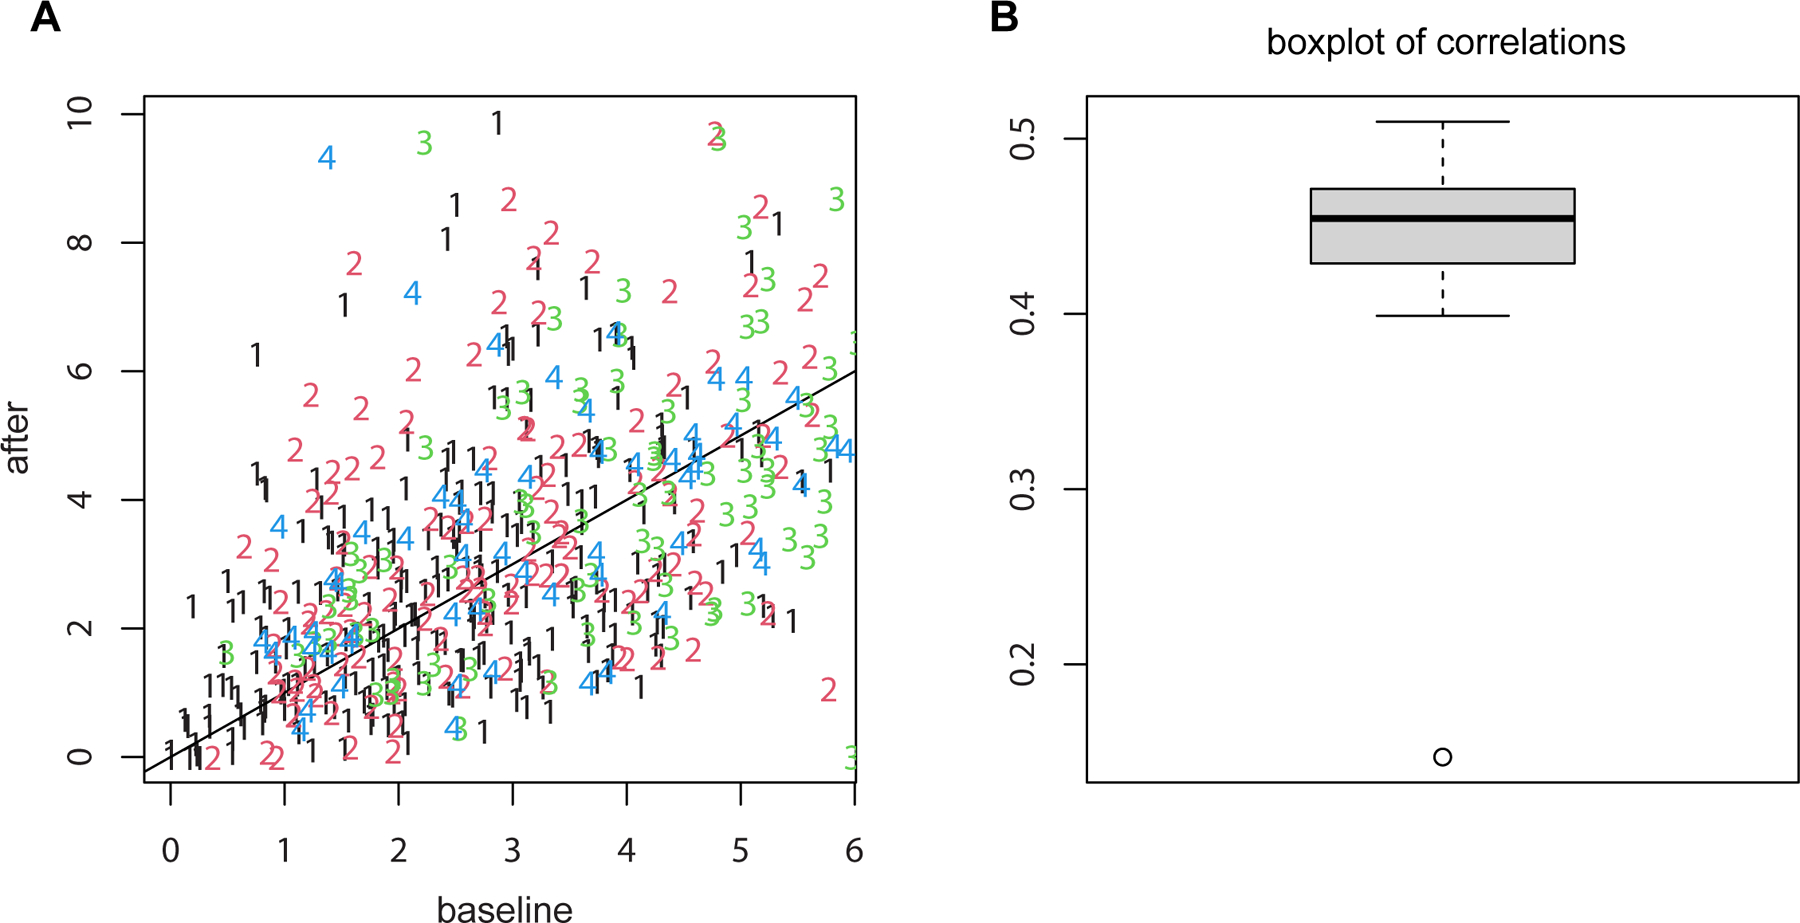
Figure 6. LME does not always lead to larger p-values than methods that ignore data dependencies.

(A) the scatter plot of Ca++ event integrated amplitude at baseline vs 24h after treatment for the neurons from four example mice (labeled as 1, 2, 3 and 4) indicates that the baseline and after-treatment measures are positively correlated. (B) boxplot of the baseline and after-treatment correlations of all the 11 mice. Due to the positive correlations shown in the data, the variance of differences is smaller when treating the data as paired than independent. As a result, LME produced a smaller p-value than t-test.
