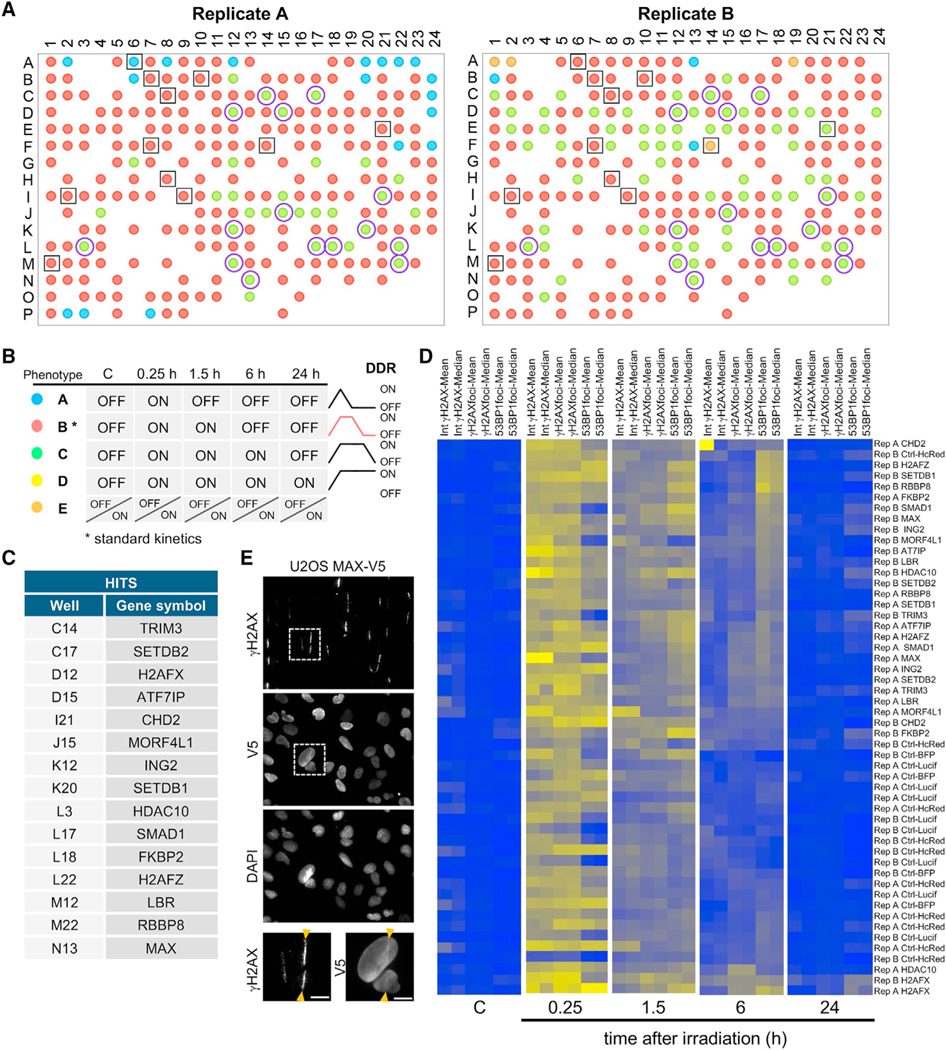
Figure 2. Analysis of the ChromORFeome HCS by machine learning uncovers chromatin factors that influence kinetics of repair.
(A) The 384-well plate layout showing the DDR kinetics phenotype for each ORF in the two ChromORFeome HCSs performed (replicate A and replicate B).
(B) Different DDR kinetics phenotypes A (blue), B (red), C (green), D (yellow) were pre-defined by the DDR status ON or OFF across the time points and are shownin a color code in the plate layout. The phenotype E (orange) consists of a different pattern of ON/OFF clusters over the time course that is not represented in the phenotypes A, B, C, or D. The control ORFs (surrounded by a black empty square in the plate layout) show a phenotype B (red) defined by an extinction of the DDR 6 h after DNA damage; we consider phenotype B the standard kinetics of the DDR. Fifteen hits were found under phenotype C (green) in both replicate experiments and are noted as purple circles in the plate layout. Phenotype C is characterized by a later extinction of the DDR (DDR OFF at 24 h after damage). No hits were found with phenotype A (blue) or D (yellow) in either replicate experiment.
(C) Table showing the list of 15 ORFs exhibiting delayed repair kinetics (phenotype C) by ML in the ChromORFeome HCS.
(D) Heatmaps of intensities of γH2AX per nucleus and number of γH2AX and 53BP1 foci per nucleus (mean and median per well) of the control ORFs and the 15 ORF hits found by ML at each time point. CHD2 was excluded by manual curation due to its anomalous γH2AX mean intensity signal.
(E) Representative images of a UV laser microirradiation experiment in U2OS cells stably expressing MAX-V5 and immunostained for γH2AX and V5-tag; nuclei were counterstained with DAPI. Arrows indicate the path of the UV laser inducing DNA breaks. Scale bars, 10 μm.

