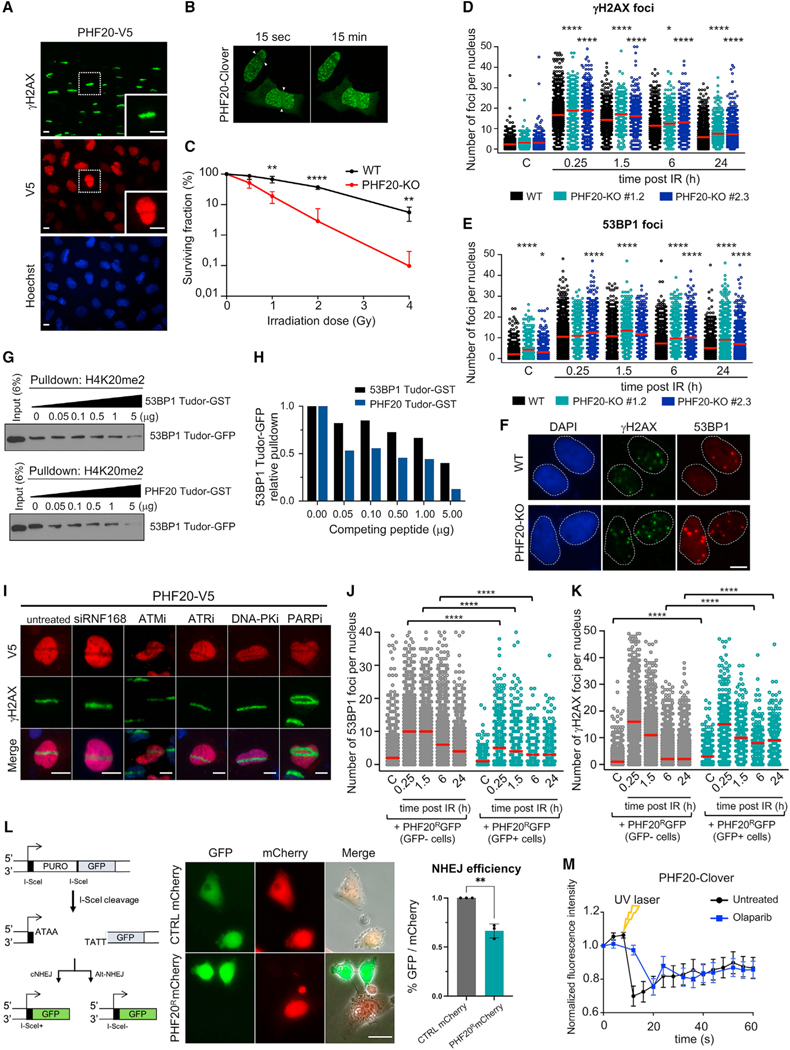
Figure 5. PHF20 is excluded from damaged chromatin, regulates the DDR by competing with 53BP1, and is required for DNA repair.
(A) Independent UV laser microirradiation experiment confirming the exclusion from DNA breaks of PHF20 in U2OS cells carrying the PHF20-V5 ORF construct. γH2AX staining is shown in green and PHF20 staining (anti-V5) is shown in red. Scale bars, 10 μm.
(B) Time-lapse video frames from U2OS cells overexpressing PHF20 subjected to live imaging laser-track irradiation (see also Video S1). U2OS cells were transfected with PHF20-Clover; cells were laser microirradiated and imaged. Time-lapse video stills at 15 s and 15 min after irradiation are shown.
(C) Wild-type (WT) and PHF20-KO U2OS cells were exposed to increasing doses of gamma irradiation (IR), and cell viability was determined by colony survival assay (mean ± SD; multiple t test, **p < 0.01; ****p < 0.0001; n = 3).
(D–F) Wild-type (WT) and two PHF20-KO U2OS cell lines were subjected to DNA damage (gamma irradiation 3 Gy), and γH2AX and 53BP1 foci were analyzed by HTM at the indicated times after irradiation. Quantification of γH2AX foci number (D) and quantification of 53BP1 foci number per cell (E) is shown (*p < 0.05; ****p < 0.0001 by one-way ANOVA with multiple comparisons, for each time point compared to WT cells). Red bars represent the mean. (F) Representative images of γH2AX and 53BP1 immunostaining in WT and PHF20-KO cells 24 h after gamma irradiation (3 Gy). Scale bars, 10 μm.
(G) Pull-down competition assay. H4K20me2 peptide was used to pull down the Tudor domain of 53BP1 fused to GFP in the presence of increasing competing amounts of 53BP1 Tudor-GST or PHF20 Tudor-GST (0, 0.05, 0.1, 0.5, 1, 5 μg). Input samples and eluted samples were immunoblotted with anti-GFP antibody.
(H) Quantification of the in vitro competition assay shown in (G); 53BP1 Tudor-GFP levels were measured and normalized to control (0 μg) sample.
(I) Representative images of UV laser microirradiation experiment in U2OS cells stably carrying the PHF20-V5 ORF construct and treated with the indicated siRNA and inhibitors. ATMi (KU-55933) 10 μM for 1 h; ATRi (Toledo et al., 2011) 1 μM for 1 h; DNA PKi (NU-7441) 3 μM for 1 h; PARPi (AZD2281, Olaparib) 10 μM for 24 h. γH2AX staining is shown in green and PHF20 staining (anti-V5) is shown in red. Scale bars, 10 μm.
(J and K) Evaluation of DDR kinetics in WT and PHF20 overexpressing U2OS cells by HTM. U2OS WT cells were transfected with a Crispr-resistant PHF20 fused to GFP (PHF20R-GFP). GFP-positive (transfected) and GFP-negative (non-transfected) cells coexisting in the same well were analyzed for 53BP1 foci (J) and γH2AX foci (K) at the indicated time points after IR (3 Gy). WT cells overexpressing PHF20 (GFP positive cells) showed decreased levels of 53BP1 nuclear foci (at 0.25, 1.5, and 6 h after IR) and increased levels of γH2AX nuclear foci in non-irradiated conditions and at late time points after DNA damage (6 h and 24 h after IR). Red bars represent the mean. (****p < 0.0001 by one-way ANOVA with multiple comparisons, for each time point compared to GFP negative cells).
(L) Left: Schematics of I-SceI assay employing EJ5-GFP cells (adapted from Bennardo et al., 2008). Middle: Representative images of U2OS cells co-transfected with CTRL-mCherry or PHF20R-mCherry (red) and I-SceI enzyme. GFP-positive cells indicate NHEJ, while mCherry represents either CTRL or PHF20 signal. Right: Quantification of NHEJ efficiency (percentage of GFP signal over mCherry signal). *p < 0.05 by Fisher’s exact test. Scale bars, 25 μm.
(M) Quantification of PHF20 levels in U2OS cells transfected with PHF20-Clover at the laser-track site in live imaging experiments, untreated (black line) and treated with the PARPi Olaparib (blue line).

