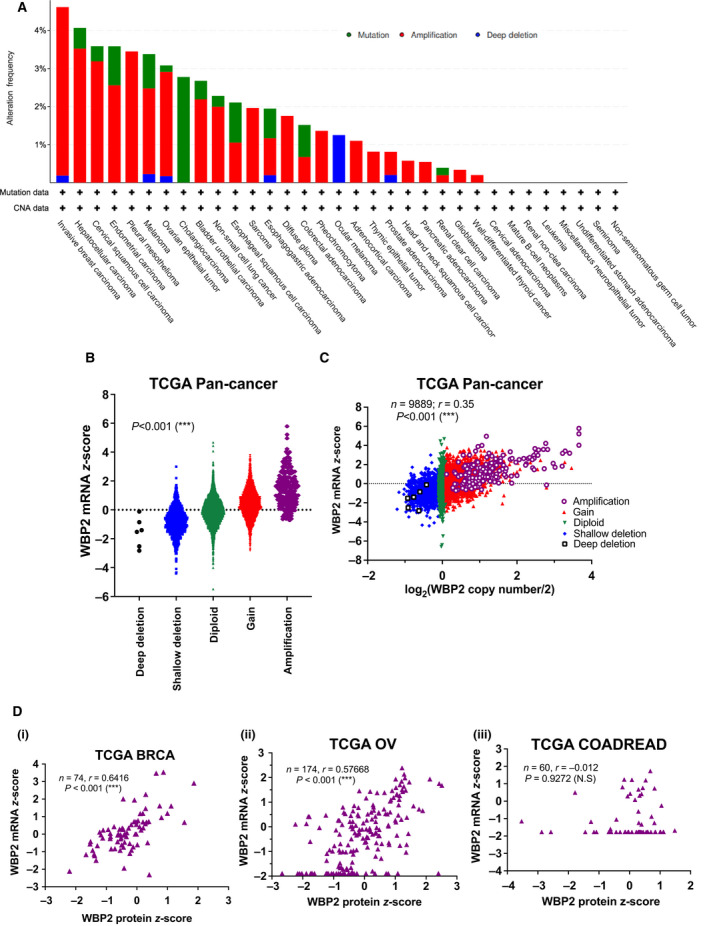
Fig. 1.

Bioinformatics analysis of WBP2 in cancers (A) WBP2 copy number alteration frequency in 32 cancer types from TCGA Pan‐cancer Atlas. The bars are colored according to the type of WBP2 alterations. The y‐axis shows the alteration frequency while x‐axis shows each cancer study in The Cancer Genome (TCGA) Pan‐cancer Atlas. (B) Swarm plot of WBP2 mRNA z‐scores in individual samples of TCGA Pan‐cancer Atlas grouped according to WBP2 copy number alterations. ***P < 0.001(one‐way ANOVA) (C) WBP2 copy number was transformed on a log2 scale and correlated with WBP2 mRNA z‐scores on a scatter plot. Each dot represents an individual sample that contains matched WBP2 mRNA z‐scores and copy number. The samples are colored according to their WBP2 copy number alterations. ***P < 0.001 (Spearman's correlation test). (D) Scatter plots indicating Spearman's correlation between WBP2 mRNA and protein z‐scores in (i) TCGA BRCA, (ii) TCGA OV (ovarian serous cystadenocarcinoma), and (iii) TCGA COADREAD (colorectal adenocarcinoma). Each dot represents a sample with matched WBP2 mRNA and protein z‐scores. ***P < 0.001; N.S, nonsignificant (Spearman's correlation test).
