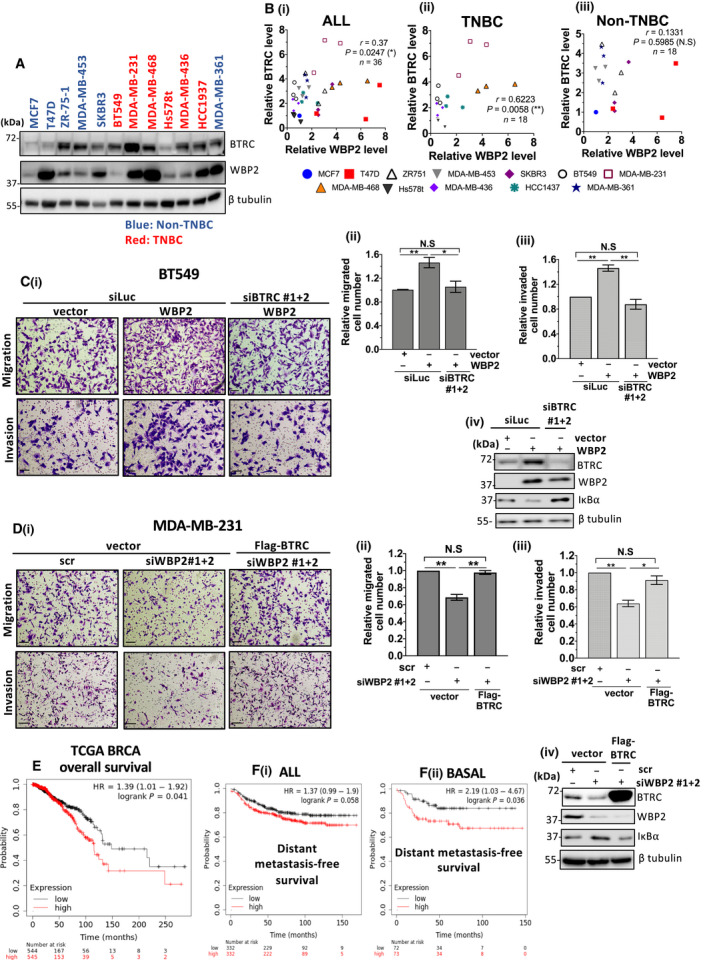
Fig. 8.

BTRC is crucial for WBP2‐driven TNBC migration and invasion, and WBP2/BTRC/IκBα is linked to poorer clinical prognosis. (A) Representative immunoblot indicating coexpression of beta‐transducin repeat containing E3 ubiquitin ligase (BTRC) and WBP2 protein levels in a screen of 12 breast cancer cell lines. The non‐TNBC cell lines are indicated in blue, while TNBC cell lines are indicated in red. (B) Scatter plot indicating the correlation between WBP2 and BTRC in (i) all cell lines (include both TNBC and non‐TNBC) (ii) non‐TNBC cell lines and (iii) TNBC cell lines. The expression of BTRC and WBP2 was measured thrice in all cell lines, except MDA‐MB‐361 which was repeated twice. Each data point represents one experimental replicate and is color‐coded according to its cell line. WBP2 and BTRC expression of all cell lines from (A) is measured relative to MCF7 via imagej. Three experimental replicates were performed for all cell lines and indicated in the scatter plot. *P < 0.05, **P < 0.01 (Spearman's correlation test). (C) BTRC reduction abolished WBP2‐driven BT549 migration and invasion cells. (D) BTRC overexpression rescued impairment in cell migration and invasion in WBP2‐depleted MDA‐MB‐231 cells. (C, D) (i) Representative images from Transwell migration and invasion assays. Cells from 10 random fields of each sample were imaged. Magnification: 10×, scale bar (black line on bottom left): 250 µm, (ii&iii) Relative number of (ii) migrated and (iii) invaded cells was quantified via imagej. Error bars indicate the SEM, n = 3. *P < 0.05 **P < 0.01 (one‐way ANOVA followed by post hoc Bonferroni test). (iv) Western blot was performed to validate WBP2 and BTRC expression. (E) Kaplan–Meier plot showing overall survival for TCGA BRCA patient. The mean WBP2, BTRC, and inverted IκBα gene expression was computed from KM plotter. All genes were given the same weightage, and only IκBα values were inverted. The TCGA BRCA patients were stratified into two groups by the median gene signature. (F) Kaplan–Meier plot showing distant metastasis‐free survival (DMFS) of (i) all breast cancer patients and (ii) basal breast cancer patients. Gene expression data and disease‐free and overall survival information are from GEO. Patient samples were split into two groups according to the median of the gene signature (mean WBP2, BTRC, and inverted IκBα gene expression computed from KM plotter). During analysis, no restriction was placed on tumor, node, metastasis classification system result, Lauren classification, gender, or treatment.
