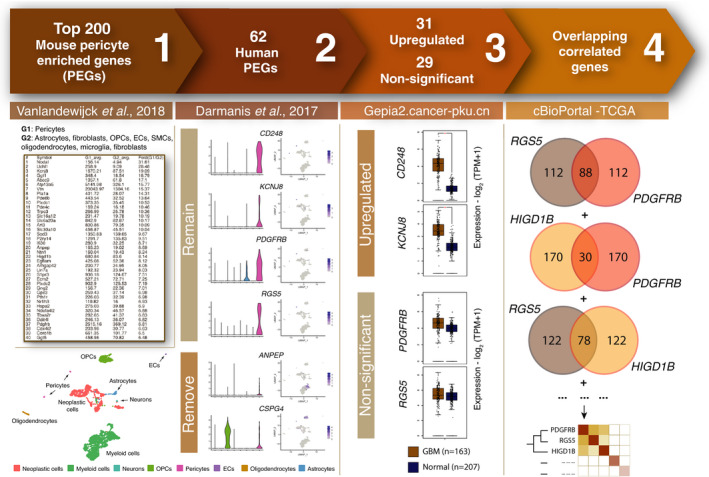
Fig. 1.

Visual representation of the workflow. (1) The top 200 genes highly expressed in mouse brain pericytes were extracted from http://betsholtzlab.org/VascularSingleCells/database.html [25, 26]. (2) Cell type expression of genes from step 1 was examined in human GBM patients [27]. Only genes that displayed highest expression among vascular cells (orange bars) remained for further analyses. (3) Genes were categorized as upregulated or nonsignificant based on their gene expression levels in GBM tissue (brown) as compared to normal brain tissue (blue; P < 0.01) [29]. (4) Correlated gene lists to each of the 62 previously selected genes were extracted from cBioPortal utilizing the TCGA GBM data set. The number of overlapping correlated genes between every existing gene pair was visualized in a heatmap with hierarchical clustering.
