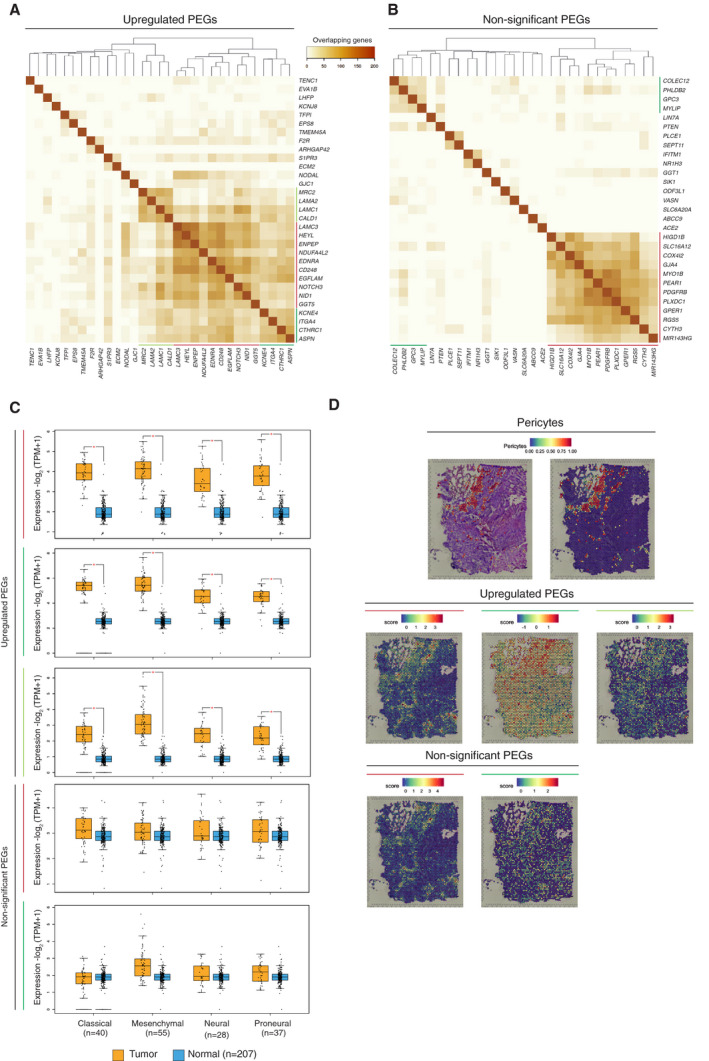
Fig. 3.

Identification of clusters among PEGs. The number of overlapping correlated genes of upregulated PEGs (A) and nonsignificant PEGs (B) is visualized as heatmaps with hierarchical clustering according to the method of complete linkage. Coloured lines indicate functionally distinct PEG clusters. Data were visualized using heatmapper.ca [31]. (C) Expression levels of each of the five PEG signatures for the classified GBM subtypes. Coloured lines match to the coloured lines from panels A and B. Statistical significance (P < 0.01) was determined by one‐way analysis of variance (ANOVA) and is indicated with an asterisk. Data were visualized with GEPIA2 [29]. (D) Spatial RNA‐sequencing visualization of the Darmanis‐pericyte signature and the five PEG signatures from panels A and B, with matching coloured lines.
