
Fig. 4.
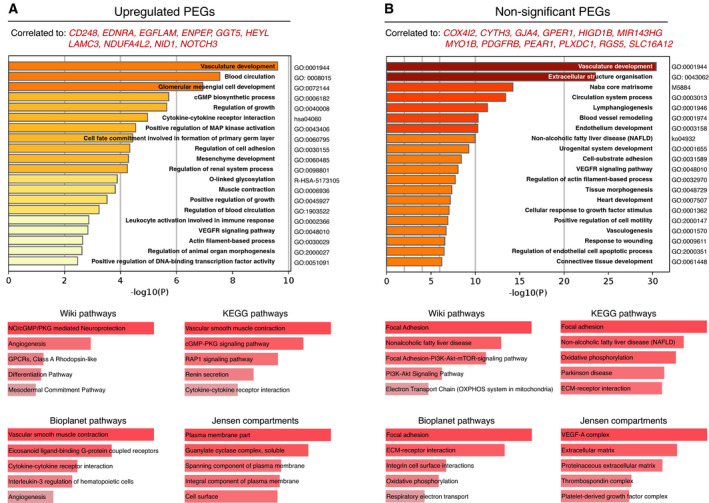
Vascular clusters of PEGs. GO term analysis of vascular upregulated PEGs (A) and vascular nonsignificant PEGs (B). Data were visualized using Metascape (top) and Enrichr (bottom). Coloured bars represent P‐values with increasing statistical significance with an increasing bar‐length.