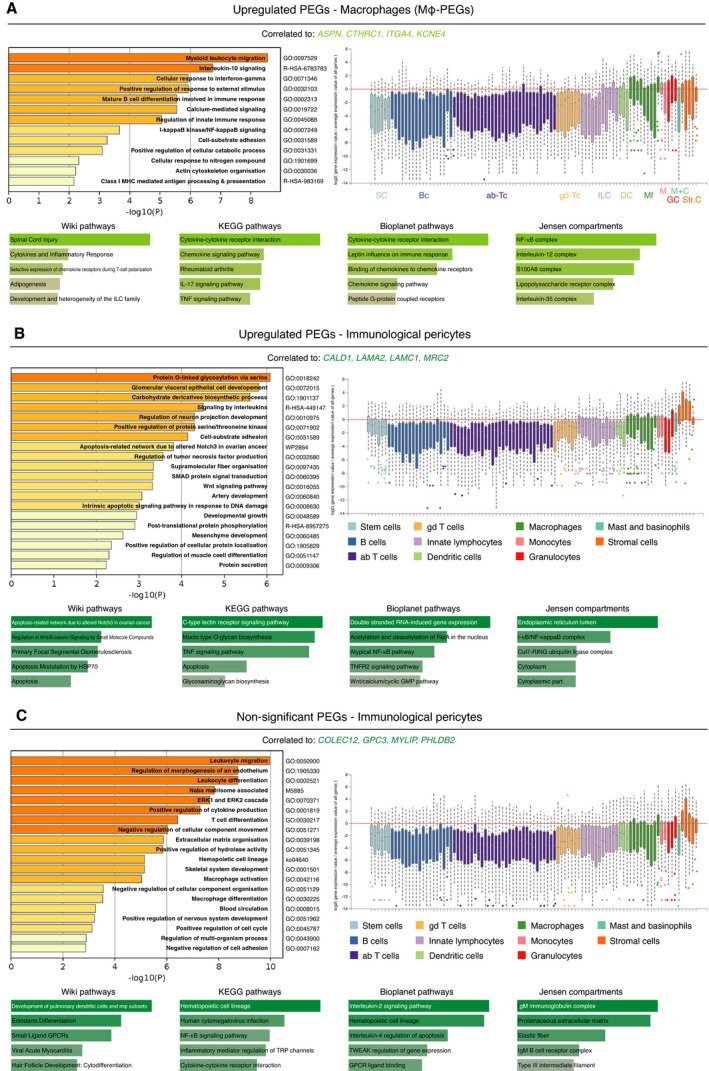
Fig. 5.

Immune clusters of PEGs. (A–D) GO term analysis with Metascape and Enrichr on common correlated genes to upregulated PEGs (A, B) and nonsignificant PEGs (C). Shades of green correspond to colour‐coding of the individual immune signature. Waterfall plot displays eleven hematopoietic cell types and their gene expression level of common correlated genes. SC, stem cells (light blue). Bc, B cells (blue). Ab‐Tc, alpha‐beta T cells (purple). Gd‐Tc, gamma‐delta T cells (yellow). ILC, innate lymphocytes (light purple). DC, dendritic cells (light green). Mf, macrophages (green). M, monocytes (pink). GC, granulocytes (red). M + C, mast and basophils (cyan). Str. C, stromal cells (orange). Data were visualized using Metascape, Enrichr, and ImmGen [31, 35, 38].
