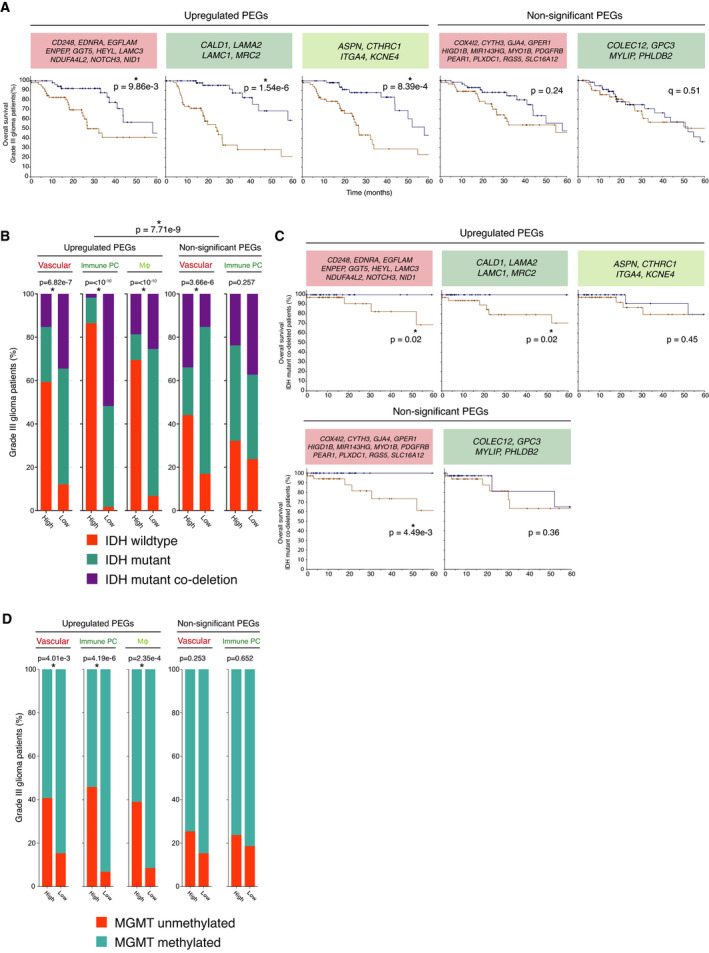
Fig. 6.

Association between expression of PEGs with a worse prognosis. (A) Kaplan–Meier analysis of overall survival (log‐rank test P‐value < 0.05) among the highest (brown) and lowest (blue) quartile of grade III patients (n = 59 per arm). (B) IDH status of grade III glioma patients that are high or low expressing (high: n = 59; low: n = 59) for upregulated and nonsignificant PEGs. Significant chi‐squared test P‐values (< 0.05) are indicated with an asterisk. (C) Kaplan–Meier analysis of overall survival (log‐rank test P‐value < 0.05) among the highest (brown) and lowest (blue) quartile of IDH mutant codeleted patients (n = 42 per arm). (D) MGMT promoter methylation status of grade III glioma patients. Data were visualized in r using the TCGA/PanCancer Atlas data set ‘Brain lower grade glioma’, and statistical significance was determined with Pearson's chi‐squared test (P < 0.05).
